

La valorisation est un sujet essentiel en immobilier. Il existe pour cela de nombreuses méthodes, utilisées par les acteurs du marché tels que les agents immobiliers, les géomètres, les promoteurs, les investisseurs ou les notaires.
Cet article a pour but de vous expliquer comment valoriser un bien en immobilier en utilisant la bonne méthode dans votre cas de figure.
La valorisation par valeur de reconstruction
La valeur de reconstruction est certainement la plus simple à comprendre et à appliquer. C’est la méthode qui est utilisée par les assurances pour déterminer le montant à indemniser. Il s’agit simplement de considérer que l’on va reconstruire un bien identique sur le terrain (déjà acquis) et y appliquer un facteur de vétusté, sur base de l’état du bien (souvent un simple coefficient par rapport à l’année de construction).
Il faut donc distinguer deux valeurs de reconstruction :
- La valeur de reconstruction à neuf : c’est simplement la valeur d’un bien similaire à construire
- La valeur de reconstruction : c’est la valeur de reconstruction à neuf à laquelle on applique un facteur (décote) de vétusté
| Prix de la reconstruction à neuf | 300.000€ |
| Coefficient de vétusté (en fonction de l’âge du bâtiment) | 0,7 |
| Valeur de reconstruction | 300.000 x 0,7 = 210.000€ |
Suivant le calcul ci-dessus, une valeur de reconstruction ne permet pas de reconstruire l’immeuble à l’identique puisqu’on a appliqué à la valeur de reconstruction à neuf un facteur diminutif.
Notez pour que la valeur par reconstruction soit comparable aux autres méthodes, il faut y ajouter la valeur du terrain (qui est englobée d’office dans les autres méthodes).
Pourquoi ajouter la valeur du terrain ? Lorsque vous reconstruisez un bâtiment, le coût du terrain ne disparaît pas, puisque le terrain reste inchangé. Le coût de la reconstruction prend uniquement en compte ce qu’il en coûte de reconstruire le bâtiment, mais le terrain a aussi une valeur, souvent significative dans certaines zones (par exemple en centre-ville ou dans des endroits prisés).
Ainsi, si la valeur de reconstruction du bâtiment après vétusté est de 210 000 €, il faut ajouter la valeur du terrain pour obtenir une estimation complète. Par exemple, si le terrain vaut 100 000 €, la valeur totale de l’immeuble serait de 210 000 € (bâtiment) + 100 000 € (terrain), soit 310 000 €.
La valorisation par capitalisation des revenus
Dans l’approche par capitalisation, la valeur est liée aux revenus locatifs du bien. L’équation pour la valeur de la propriété est la suivante :
Valeur actuelle = Revenu net d’exploitation / Taux de capitalisation
Le taux de capitalisation est déterminé sur base de l’observation du marché local et sur le segment considéré. En effet, le taux de capitalisation dépend de :
- La localisation : le taux de capitalisation est plus faible dans les bonnes localisations. La logique sous-jacente est qu’un investisseur accepte un loyer un peu moindre si la localisation est très bonne. À l’inverse, pour attirer un investisseur dans une plus petite ville, il faudra que le taux de capitalisation soit élevé (proportionnel au rendement).
- Le segment : le taux de capitalisation en immobilier commercial et retail est plus important qu’en résidentiel, notamment pour couvrir le risque de chômage locatif.
Pour prendre un exemple, un bien d’investissement dont le revenu annuel net d’exploitation est de 700.000 euros et le taux de capitalisation est de 6% vaudrait 11.7M€.
L’avantage de cette méthode est qu’elle tient compte du rendement réel du bien. Elle tend à surestimer les biens ayant un bon rendement (ex : immeuble de logements étudiants) et sous-estimer les biens ayant un mauvais rendement (ex : maison unifamiliale).
Vous cherchez à déterminer un revenu locatif ou un taux de capitalisation dans un cas concret ? Consultez notre article comment valoriser un bien par capitalisation pour découvrir comment obtenir ces informations directement dans notre outil d’analyse Market Explorer.
La valorisation par comparaison
Aussi appelée « méthode des points de comparaison », c’est probablement la méthode la plus utilisée et la plus intuitive puisqu’il s’agit simplement de comparer un bien avec des biens similaires à proximité. Ces biens seront alors comparés, en tenant compte de leurs similarités et de leurs différences.
En effet, deux biens ne seront jamais parfaitement identiques. L’un deux pourra avoir été rénové partiellement alors que l’autre pas, l’un des deux peut également disposer d’une véranda, d’une piscine ou d’un autre élément augmentant sa valeur de marché.
Il vous faudra d’abord obtenir des comparables (via un site d’annonce ou un outil de points de comparaison) afin de les répertorier dans un tableau Excel avec les caractéristiques essentielles.
Pour un bien résidentiel, voici les informations principales à recueillir :
- La date de vente ou de mise en vente
- Le prix
- Le nombre de chambres
- La surface habitable (telle que reprise sur le certificat énergétique PEB par exemple)
- L’état du bien
- La performance énergétique
Voici un tableau de points de comparaison obtenu grâce à l’application Market Explorer :
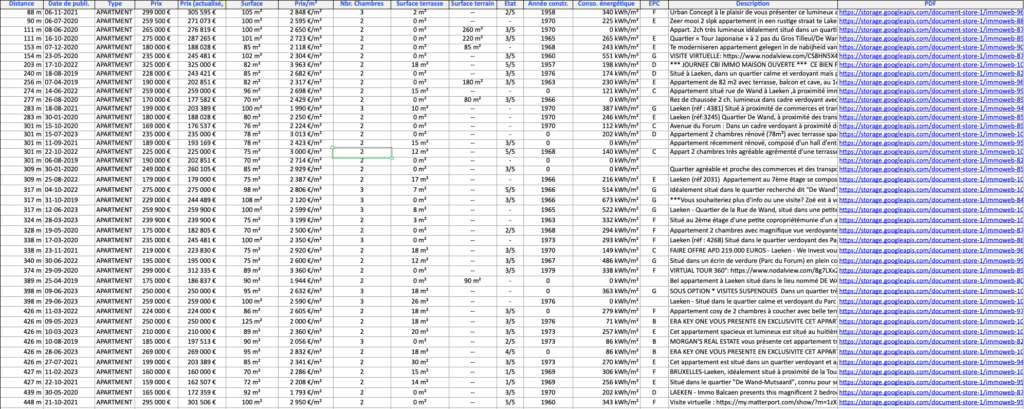
Il est alors très utile de calculer le prix/m2, le prix moyen ou de réaliser un histogramme des prix. Cela vous permettra de compléter votre analyse avec le prix minimal, médian et maximal de l’échantillon.
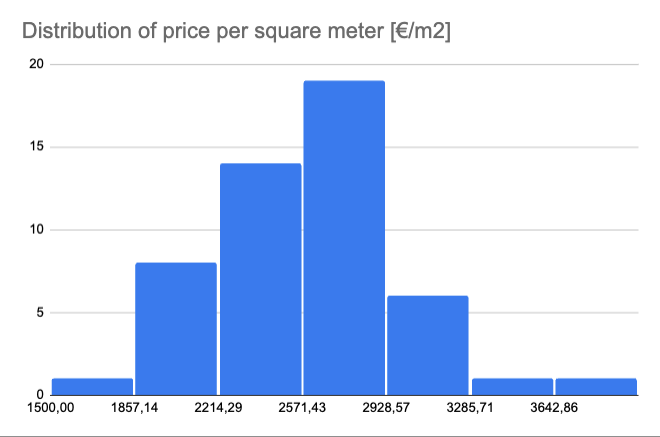
Grâce à l’histogramme, on constate que 19 biens sont dans l’intervalle 2570€/m2 à 2928€/m2. Par contre, il n’y a qu’un bien en dessous de 1857€/m2 et un bien au-dessus de 3642€/m2. Pour cet échantillon, le prix médian est de 2597€/m2.
Comparaison des méthodes
Même si ces méthodes sont complémentaires, certaines d’entre elles sont à privilégier dans des contextes spécifiques. C’est ce que nous allons voir ci-dessous :
| Méthode | Cas d’utilisation | Données nécessaires | Avantages | Inconvénients |
|---|---|---|---|---|
| Valeur de reconstruction | Assurance | – Prix de la construction (€/m2) – Surface brute (m2) – Niveau de vétusté | ✅ Facile à calculer ✅ Besoin de peu d’informations | ❌ Approche simpliste ❌ Parfois assez éloignées des valeurs de marché ❌ Grande sensibilité du résultat par rapport au coefficient de vétusté choisi |
| Valeur par capitalisation | Bien d’investissement : immeuble de rapport, logement étudiant, immeuble de bureau ou commerce. | – Loyer réel ou estimé – Taux de capitalisation | ✅ Permet de se placer dans la position de l’investisseur, avec un rendement en tête – Permet souvent d’obtenir plus que par les autres méthodes si l’immeuble est rentable | ❌ Donne parfois des valeurs « hors marché », si l’immeuble est très rentable (ex : location AirBNB) |
| Valeur par comparaison | Bien non destiné au rendement | – Points de comparaison | ✅ Méthode tenant compte de l’état réel du marché | ❌ Besoin d’obtenir des points de comparaison, parfois difficiles à trouver |
Il est souvent très utile et instructif de comparer les valeurs obtenues par les différentes méthodes, notamment dans le cas d’un changement d’affectation (bureau vers résidentiel, logement traditionnel vers logement étudiant).
Exemple
Prenons le cas d’une maison de 200 m² sur un terrain de 1000 m² en périphérie de Nivelles (Brabant-Wallon).
| Méthode | Calcul | Valeur obtenue |
|---|---|---|
| Valorisation par reconstruction | – Terrain : 170.000€ (170€/m2) – Construction : 360.000€ (1.800€/m2) – Vétusté : 25% – Valeur de reconstruction : 424.000€ | 424.000€ |
| Valorisation par capitalisation | – Loyer : 1.280€/mois (6,4€/m2) – Taux de capitalisation : 3,4% | 384.000€ |
| Valorisation par comparaison | – Prix spécifique médian : 2.088€/m2 – Prix global : 417.600€ | 417.600 |
Il est intéressant de noter les éléments suivants :
- pour un investisseur, le rendement attendu sera sans doute de 4% brut minimum. Pour investir dans le bien, tenant compte du loyer et du rendement attendu, l’investisseur ne voudra donc pas débourser plus de 384.000€ (soit 8% de moins que la valeur par comparaison).
- la valeur de reconstruction est assez sensible au coefficient de vétusté choisi. En faisant varier de 5% à la baisse et à la hausse, on obtient une fourchette de 397.000€ à 450.500€.
- pour un immeuble de rapport, on peut calculer la valeur par capitalisation (car il s’agit d’un bien d’investissement) et diviser la valeur par la surface pour obtenir le prix/m2. Vous pouvez ensuite comparer ce prix/m2 à celui obtenu par comparaison.
Conclusions
Nous avons vu trois méthodes de valorisation :
- La valorisation par valeur de reconstruction
- La valorisation par capitalisation des revenus
- La valorisation par comparaison
Chacune de ces méthodes peut être utilisée dans un contexte spécifique, mais il est toujours intéressant de les utiliser conjointement et d’en comparer les résultats.
Vous avez besoin de données pour vos estimations ? Notre application Market Explorer dispose d’un historique important sur plusieurs segments de marché et partout en Belgique. Contactez-nous pour en savoir plus !