In this article
- Since 1975
- Since 2022
- Price evolution by neighbourhood in Brussels (2022-2021)
- Price map by neighbourhood in Brussels (2022)
Since 1975
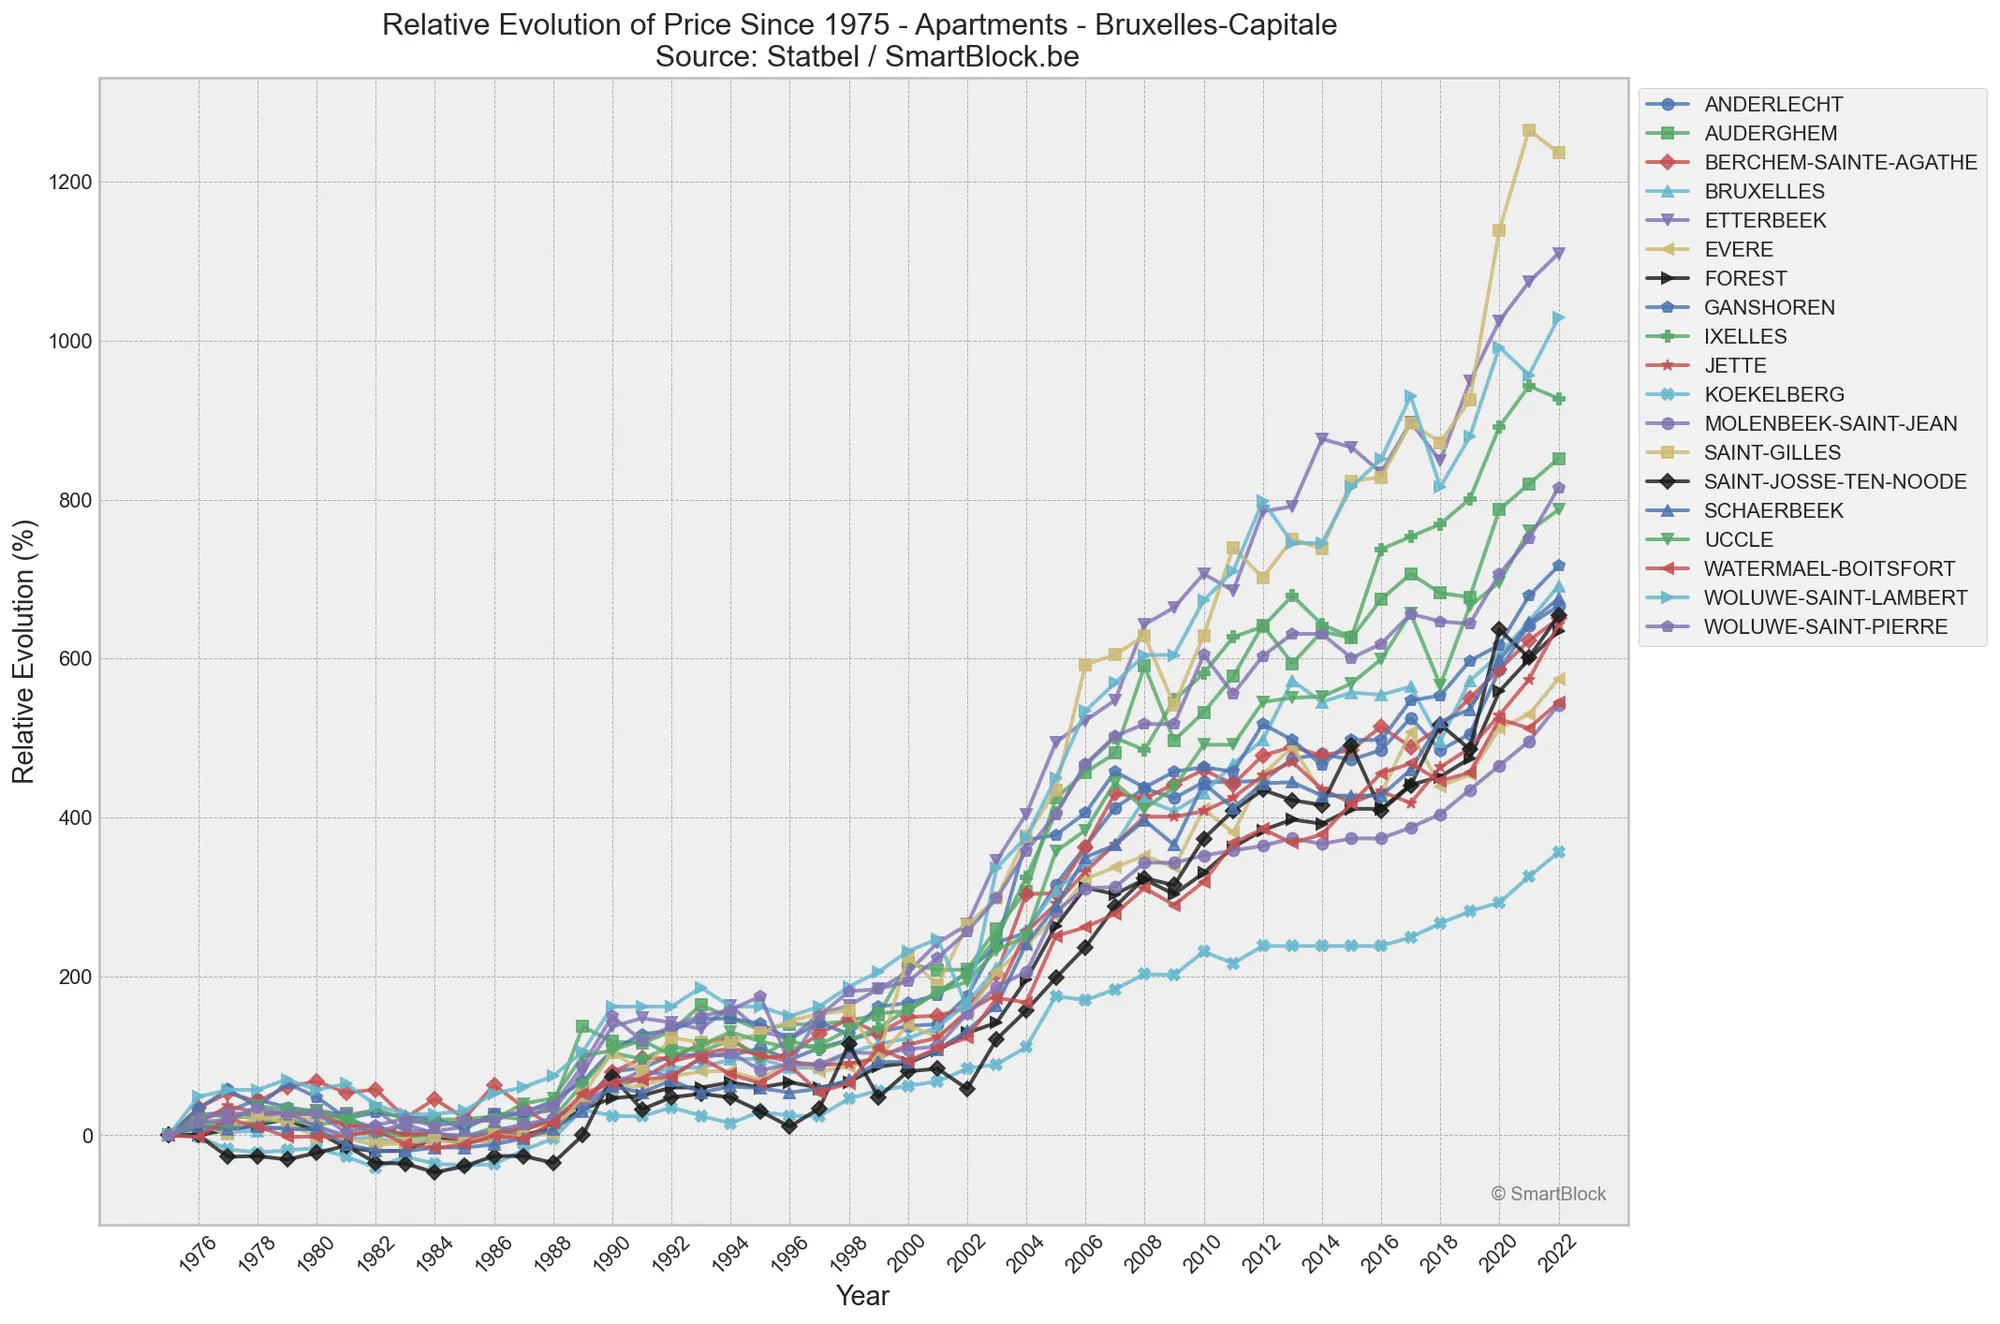
Apartments in Brussels-Capital have seen their prices increase by 742% on average over the period 1975-2022.
This average hides clear disparities:
- Saint-Gilles (+1200%), Etterbeek (+1100%) and Woluwe-Saint-Lambert (+1029%) rose much more sharply than the others
- Koekelberg (+356%) stands out from the other municipalities with its low price increase.
A bit of context to put these changes in perspective:
- 1989: The creation of the Brussels-Capital Region marked a turning point in the urban management and development of the region.
- 1993: The seat of the European Union is definitively fixed in Brussels.
- 2000: Brussels officially becomes the capital of the European Union with the inauguration of the European Council headquarters. The annual net international migration doubles in 2021 [1].
- 2004-2007: The enlargement of the European Union to new Central and Southern European countries may have had an impact on the demand for offices and housing in Brussels. Again, net international migration doubles between 2004 and 2010 [1].
Finally, this period is also marked by an overall decline in interest rates and a rise in household incomes.
[1] Demographic Barometer 2022, Brussels-Capital Region, IBSA – perspective.brussels (link).
Find the detail below, municipality by municipality:
| Municipality | Median price – 1975 | Median price – 2022 | Change |
|---|---|---|---|
| ANDERLECHT | €24,789 | €190,000 | +666% |
| AUDERGHEM | €30,986 | €295,000 | +852% |
| BERCHEM-SAINTE-AGATHE | €27,677 | €207,750 | +650% |
| BRUSSELS | €33,466 | €265,000 | +691% |
| ETTERBEEK | €23,550 | €285,000 | +1110% |
| EVERE | €34,296 | €231,500 | +575% |
| FOREST | €37,184 | €273,250 | +634% |
| GANSHOREN | €25,099 | €205,000 | +716% |
| IXELLES | €31,631 | €325,000 | +927% |
| JETTE | €28,941 | €215,000 | +642% |
| KOEKELBERG | €45,810 | €209,000 | +356% |
| MOLENBEEK-SAINT-JEAN | €32,722 | €210,000 | +541% |
| SAINT-GILLES | €20,575 | €275,000 | +1236% |
| SAINT-JOSSE-TEN-NOODE | €28,508 | €215,000 | +654% |
| SCHAERBEEK | €32,226 | €250,000 | +675% |
| UCCLE | €37,184 | €330,000 | +787% |
| WATERMAEL-BOITSFORT | €44,893 | €289,500 | +544% |
| WOLUWE-SAINT-LAMBERT | €28,384 | €320,500 | +1029% |
| WOLUWE-SAINT-PIERRE | €39,663 | €363,000 | +815% |
| Table of median price evolution (apartments) by municipality – Brussels-Capital Region. Source: statbel.be |
Since 2022
Price evolution by neighbourhood in Brussels (2022-2021)
How have prices evolved, neighbourhood by neighbourhood, in the Brussels Region?
To analyse this evolution, we studied the price of more than 15,000 apartments and houses. Breaking the data down by neighbourhood makes it possible to see changes that can differ within the same municipality:
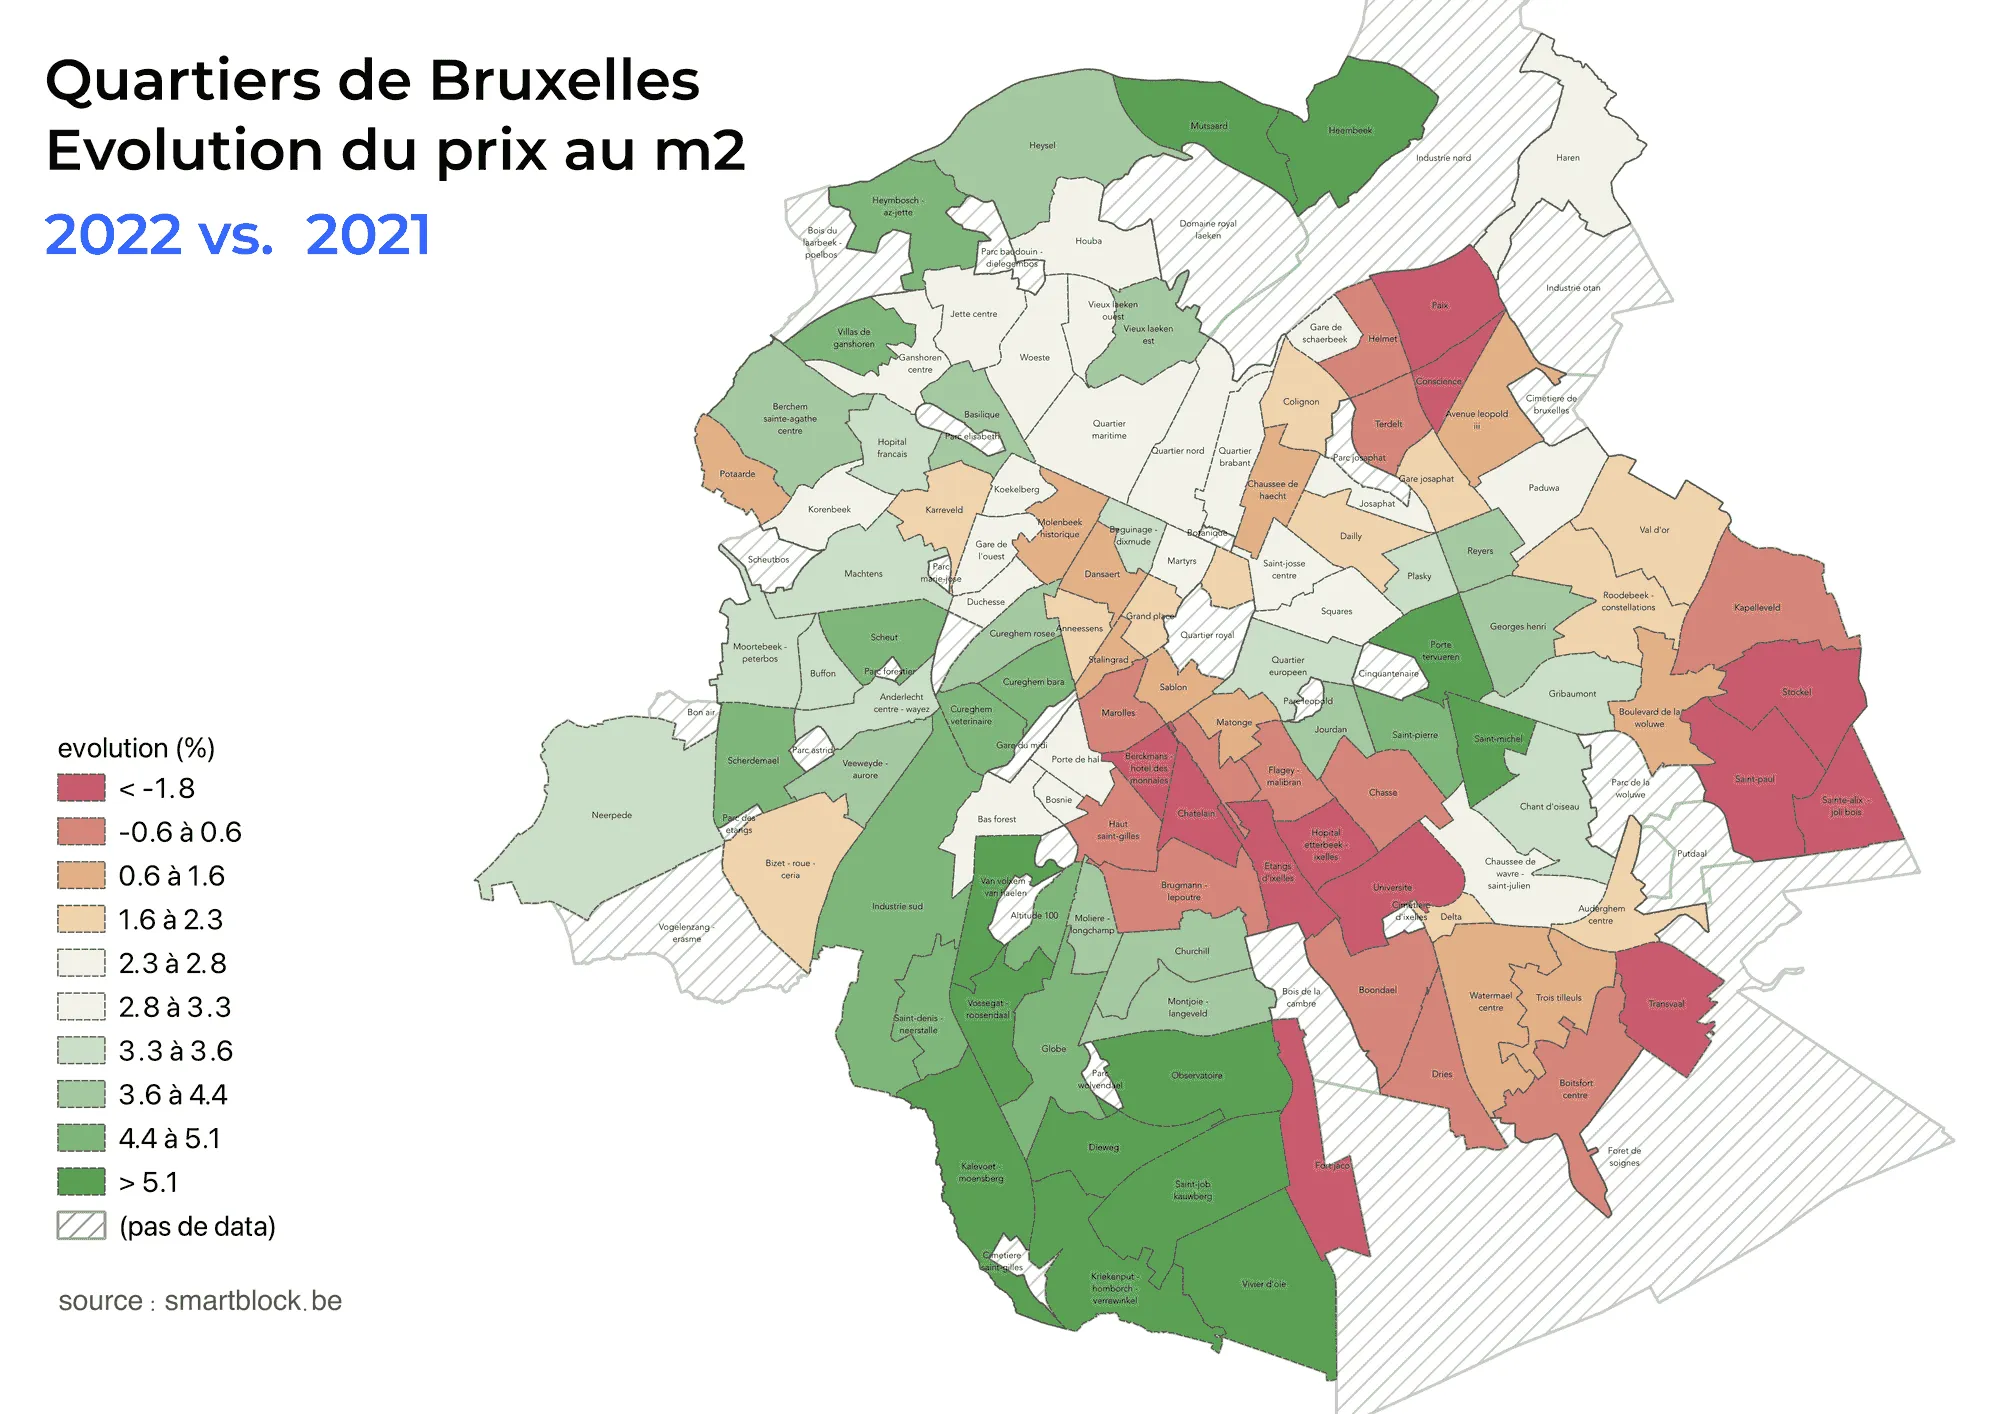
Overall, 2022 marked a stagnation in prices in the most expensive neighbourhoods, while others caught up some of their lag.
- The west of Brussels, where neighbourhoods with prices between €2,000 and €3,000 per m² are concentrated, rose by 3 to 6%.
- The Ixelles and Woluwe-Saint-Pierre neighbourhoods saw their prices stagnate or even decline (from -2% to 1%). These are also the most expensive municipalities in Brussels, with a price per m² above €4,000/m².
- The south of Uccle recorded an increase of more than 5%, even though its price per m² is already among the highest in the capital.
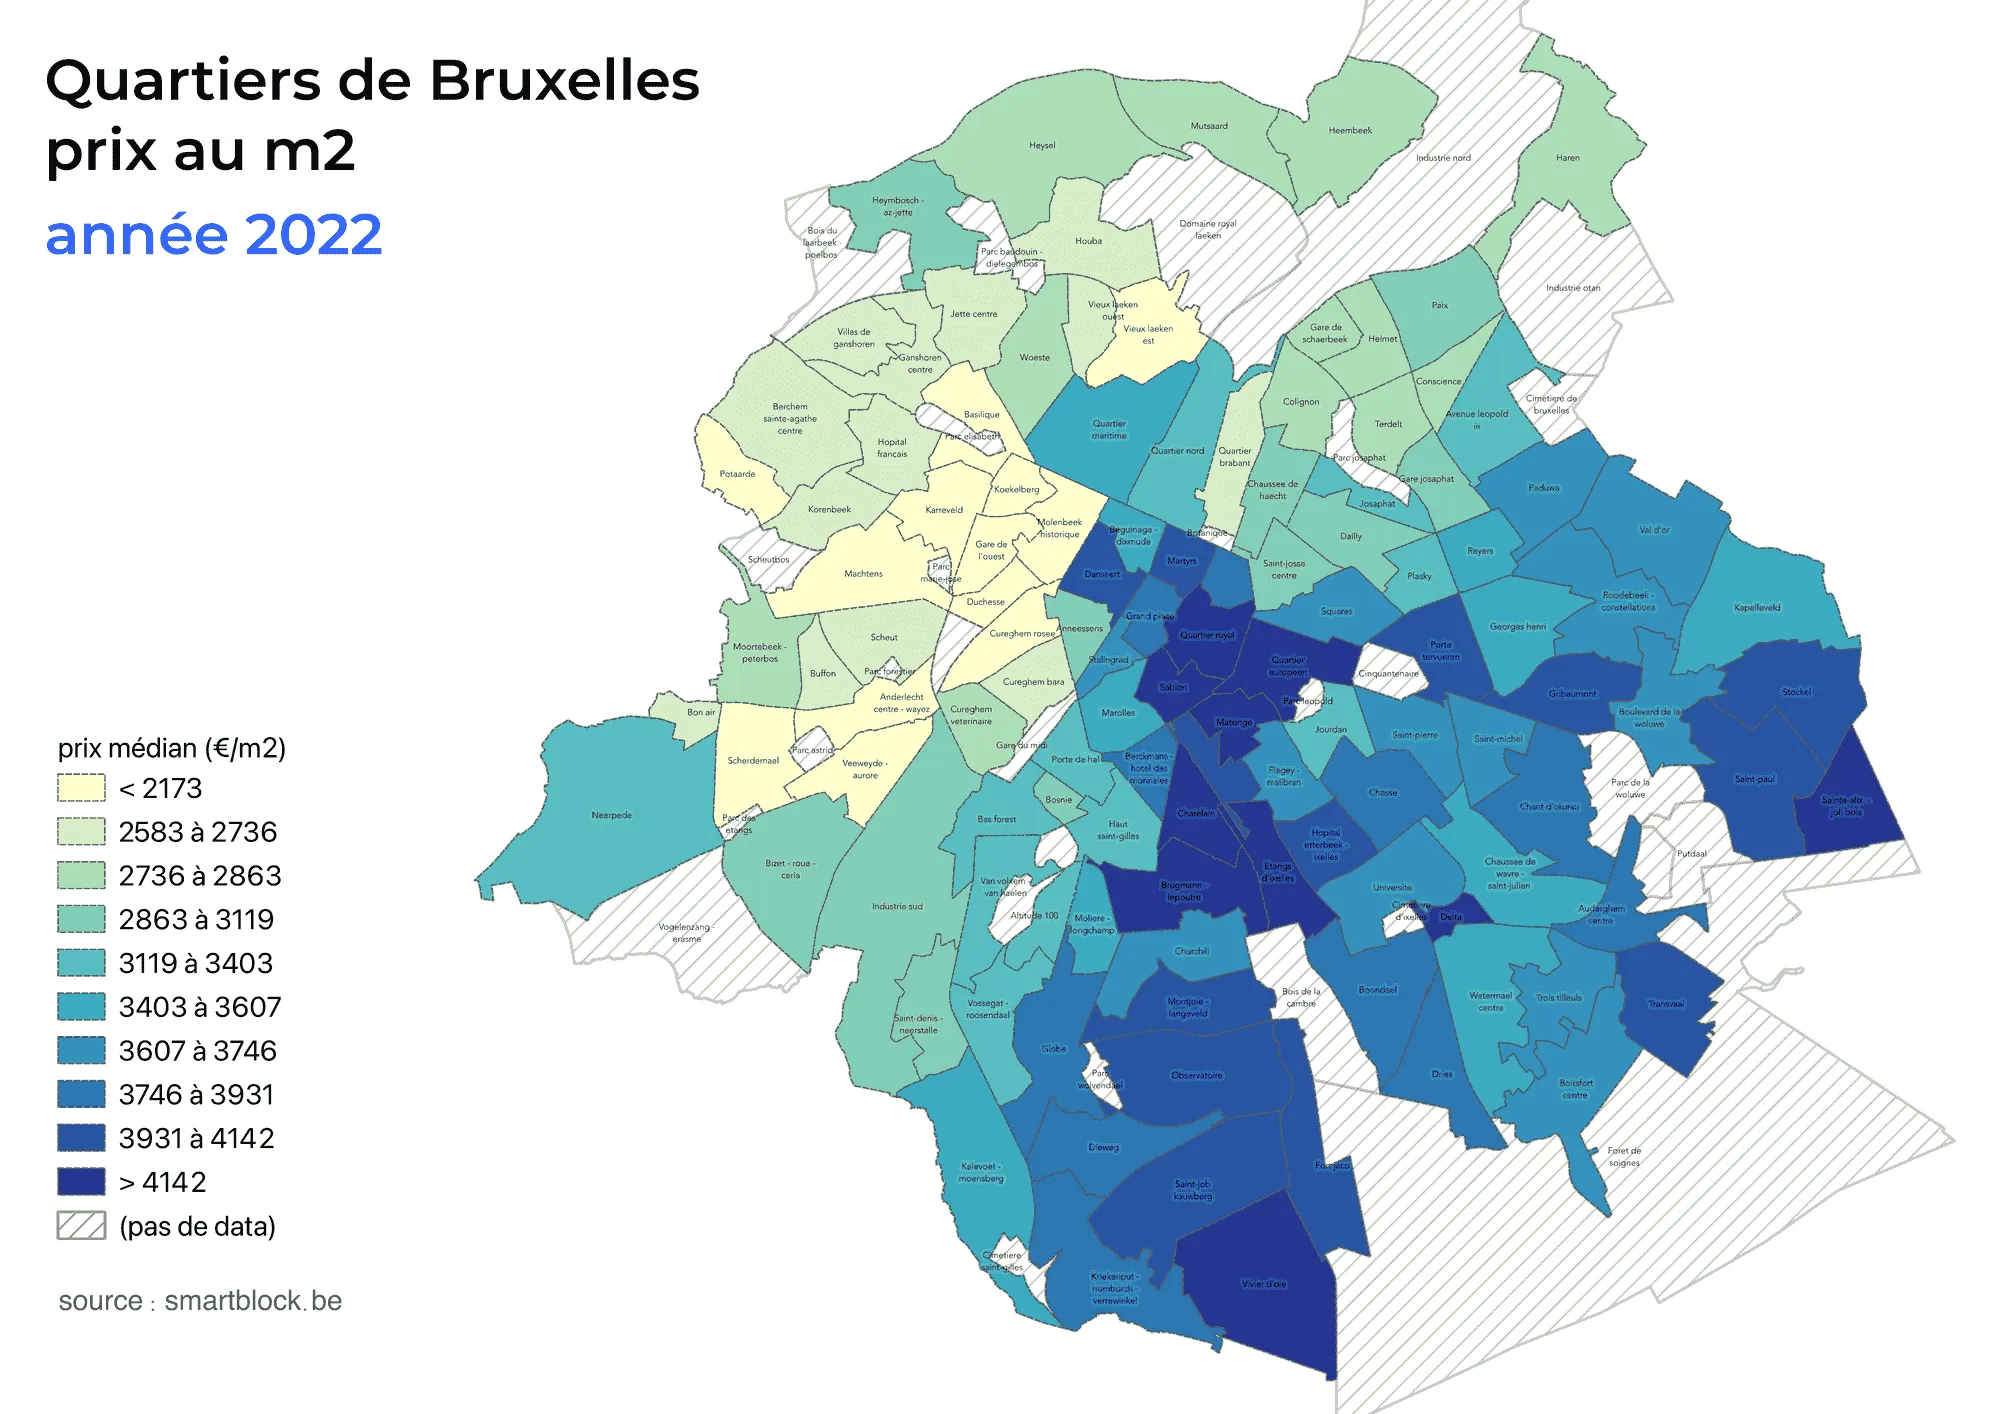
Price map by neighbourhood in Brussels (2022)
Historically, the most expensive municipalities in Brussels are located in the south and south-east of the Region. The following map shows the median price (per m²) for the residential market (apartments and houses):