
Depuis 1975
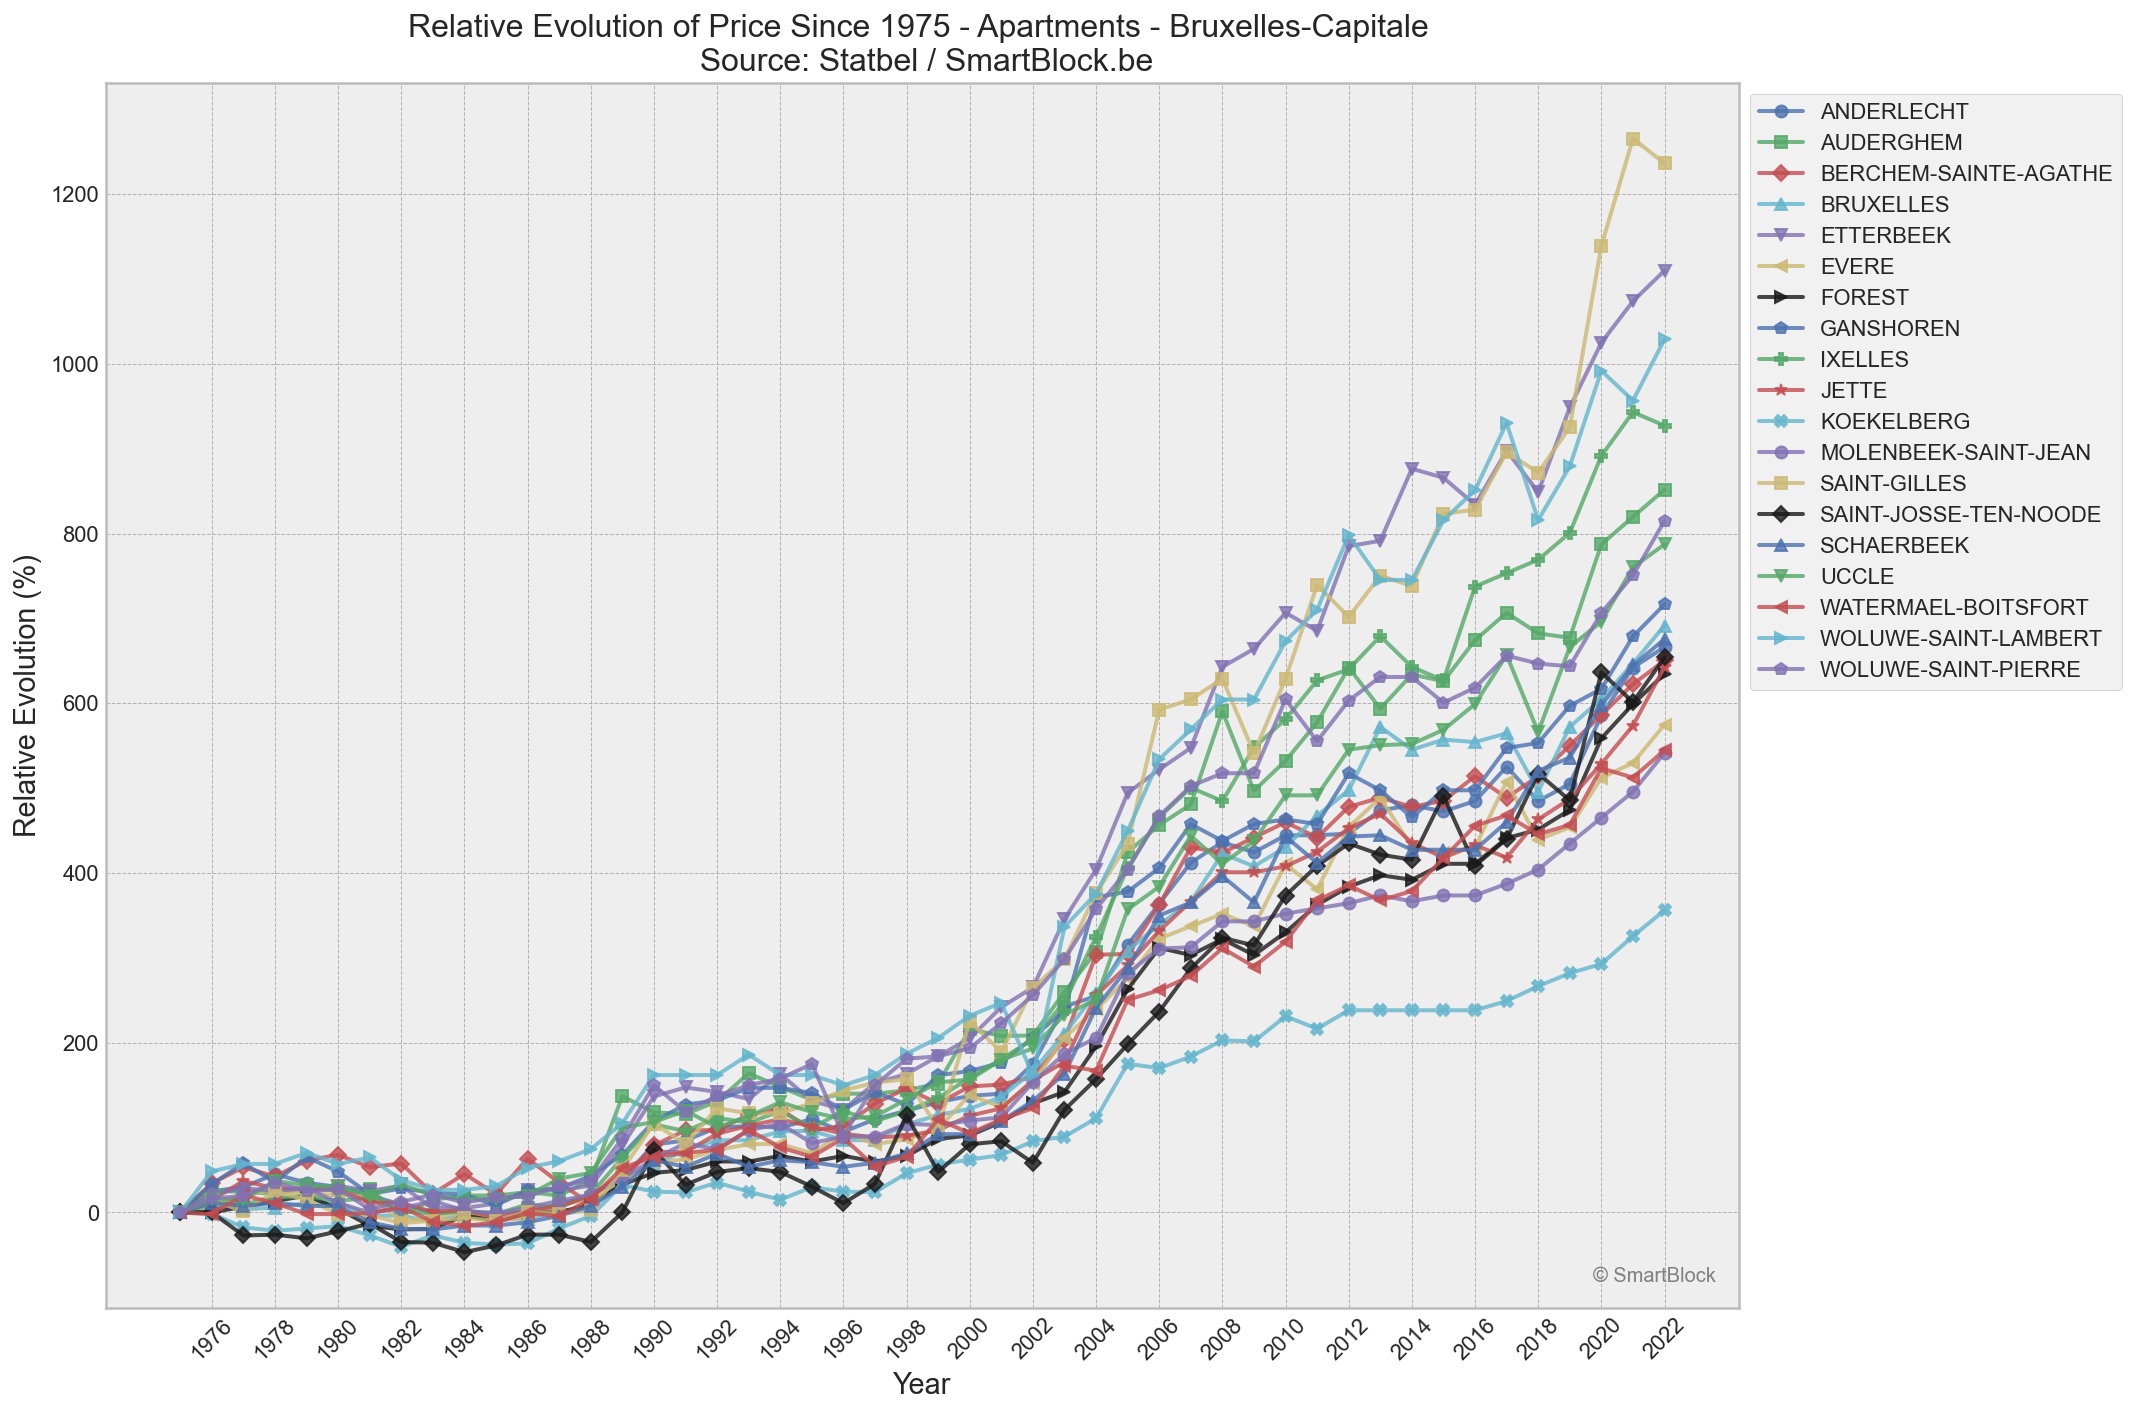
Les appartements à Bruxelles-Capitale ont vu leurs prix augmenter de 742% en moyenne sur la période 1975-2022.
Cette moyenne cache de claires disparités :
- Saint-Gilles (+1200%), Etterbeek (+1100%) et Woluwe-Saint-Lambert (+1029%) ont évolué bien plus fortement que les autres
- Koekelberg (+356%) se détache des autres communes par sa faible augmentation des prix.
Un peu de contexte pour replacer les évolutions :
- 1989 : La création de la Région de Bruxelles-Capitale marque un tournant dans la gestion urbaine et l’urbanisation de la région.
- 1993 : Le siège de l’Union Européenne est définitivement fixé à Bruxelles.
- 2000 : Bruxelles devient officiellement la capitale de l’Union européenne avec l’inauguration du siège du Conseil européen. Le solde migratoire international annuel double en 2021 [1].
- 2004-2007 : L’élargissement de l’Union européenne à de nouveaux pays d’Europe centrale et Europe du Sud a pu avoir des répercussions sur la demande de bureaux et de logements à Bruxelles. À nouveau, le solde migratoire international fait x2 entre 2004 et 2010 [1].
Enfin, cette période est également marquée par une baisse des taux d’intérêts globale et hausse des revenus des ménages.
[1] Baromètre démographique 2022, de la Région de Bruxelles-Capitale, IBSA – perspective.brussels (lien).
Retrouvez ci-dessous le détail, commune par commune :
| Commune | Prix médian – 1975 | Prix médian – 2022 | Évolution |
|---|---|---|---|
| ANDERLECHT | 24.789 € | 190.000 € | +666 % |
| AUDERGHEM | 30.986 € | 295.000 € | +852 % |
| BERCHEM-SAINTE-AGATHE | 27.677 € | 207.750 € | +650 % |
| BRUXELLES | 33.466 € | 265.000 € | +691 % |
| ETTERBEEK | 23.550 € | 285.000 € | +1110 % |
| EVERE | 34.296 € | 231.500 € | +575 % |
| FOREST | 37.184 € | 273.250 € | +634 % |
| GANSHOREN | 25.099 € | 205.000 € | +716 % |
| IXELLES | 31.631 € | 325.000 € | +927 % |
| JETTE | 28.941 € | 215.000 € | +642 % |
| KOEKELBERG | 45.810 € | 209.000 € | +356 % |
| MOLENBEEK-SAINT-JEAN | 32.722 € | 210.000 € | +541 % |
| SAINT-GILLES | 20.575 € | 275.000 € | +1236 % |
| SAINT-JOSSE-TEN-NOODE | 28.508 € | 215.000 € | +654 % |
| SCHAERBEEK | 32.226 € | 250.000 € | +675 % |
| UCCLE | 37.184 € | 330.000 € | +787 % |
| WATERMAEL-BOITSFORT | 44.893 € | 289.500 € | +544 % |
| WOLUWE-SAINT-LAMBERT | 28.384 € | 320.500 € | +1029 % |
| WOLUWE-SAINT-PIERRE | 39.663 € | 363.000 € | +815 % |
Depuis 2022
Évolution des prix par quartier à Bruxelles (2022-2021)
Comment a évolué les prix, quartier par quartier, en région Bruxelloise ?
Pour analyser cette évolution, nous avons étudié le prix de plus de 15,000 appartements et maisons. Le découpage quartier par quartier permet d’apprécier des évolutions qui peuvent être différentes au sein d’une même commune :
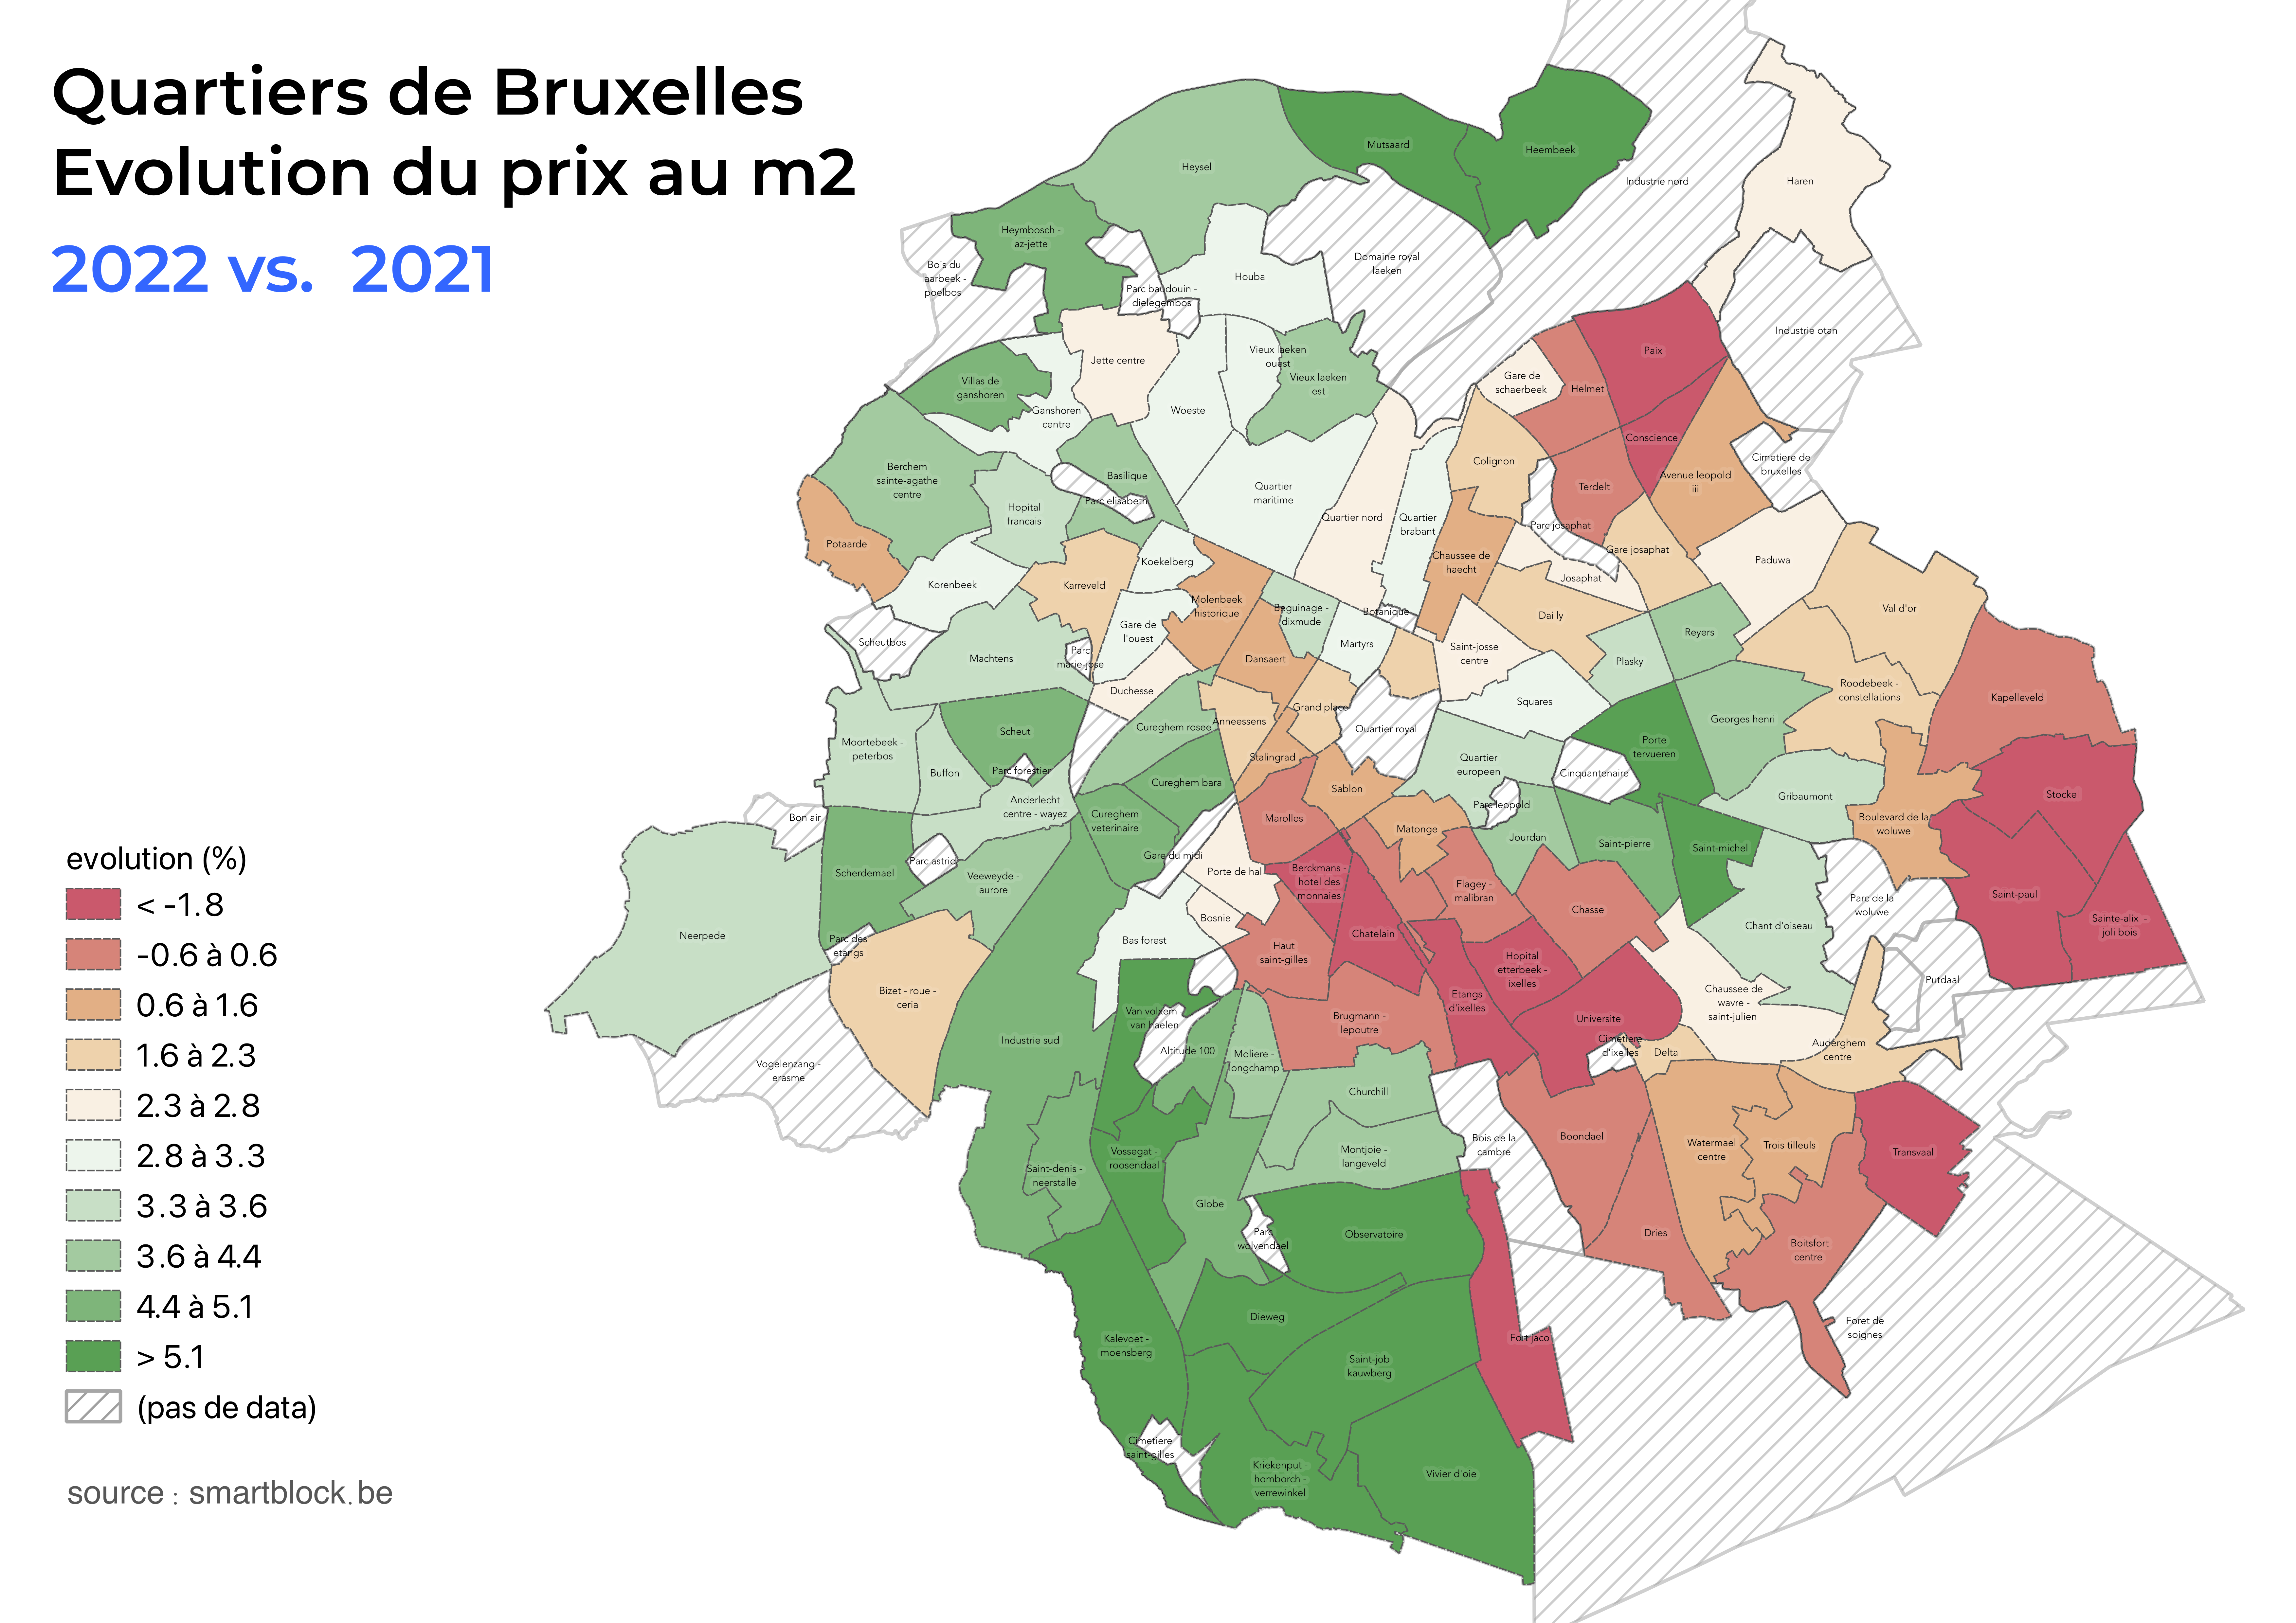
Globalement, 2022 a marqué une stagnation des prix concernant les quartiers les plus chers, tandis que les autres rattrapent leur retard.
- L’ouest de Bruxelles, où se concentrent les quartiers avec les prix au m2 entre 2000€ et 3000€ du m2, a augmenté de 3 à 6%.
- Les quartiers d’Ixelles et de WSP voient leur prix stagner voir baisser (de -2% à 1%). Ce sont aussi les communes les plus chères de Bruxelles avec un prix au m2 au-delà de 4000€/m2.
- Le sud d’Uccle enregistre une évolution de plus de 5% alors que le prix du m2 fait partie des plus élevés de la capitale.
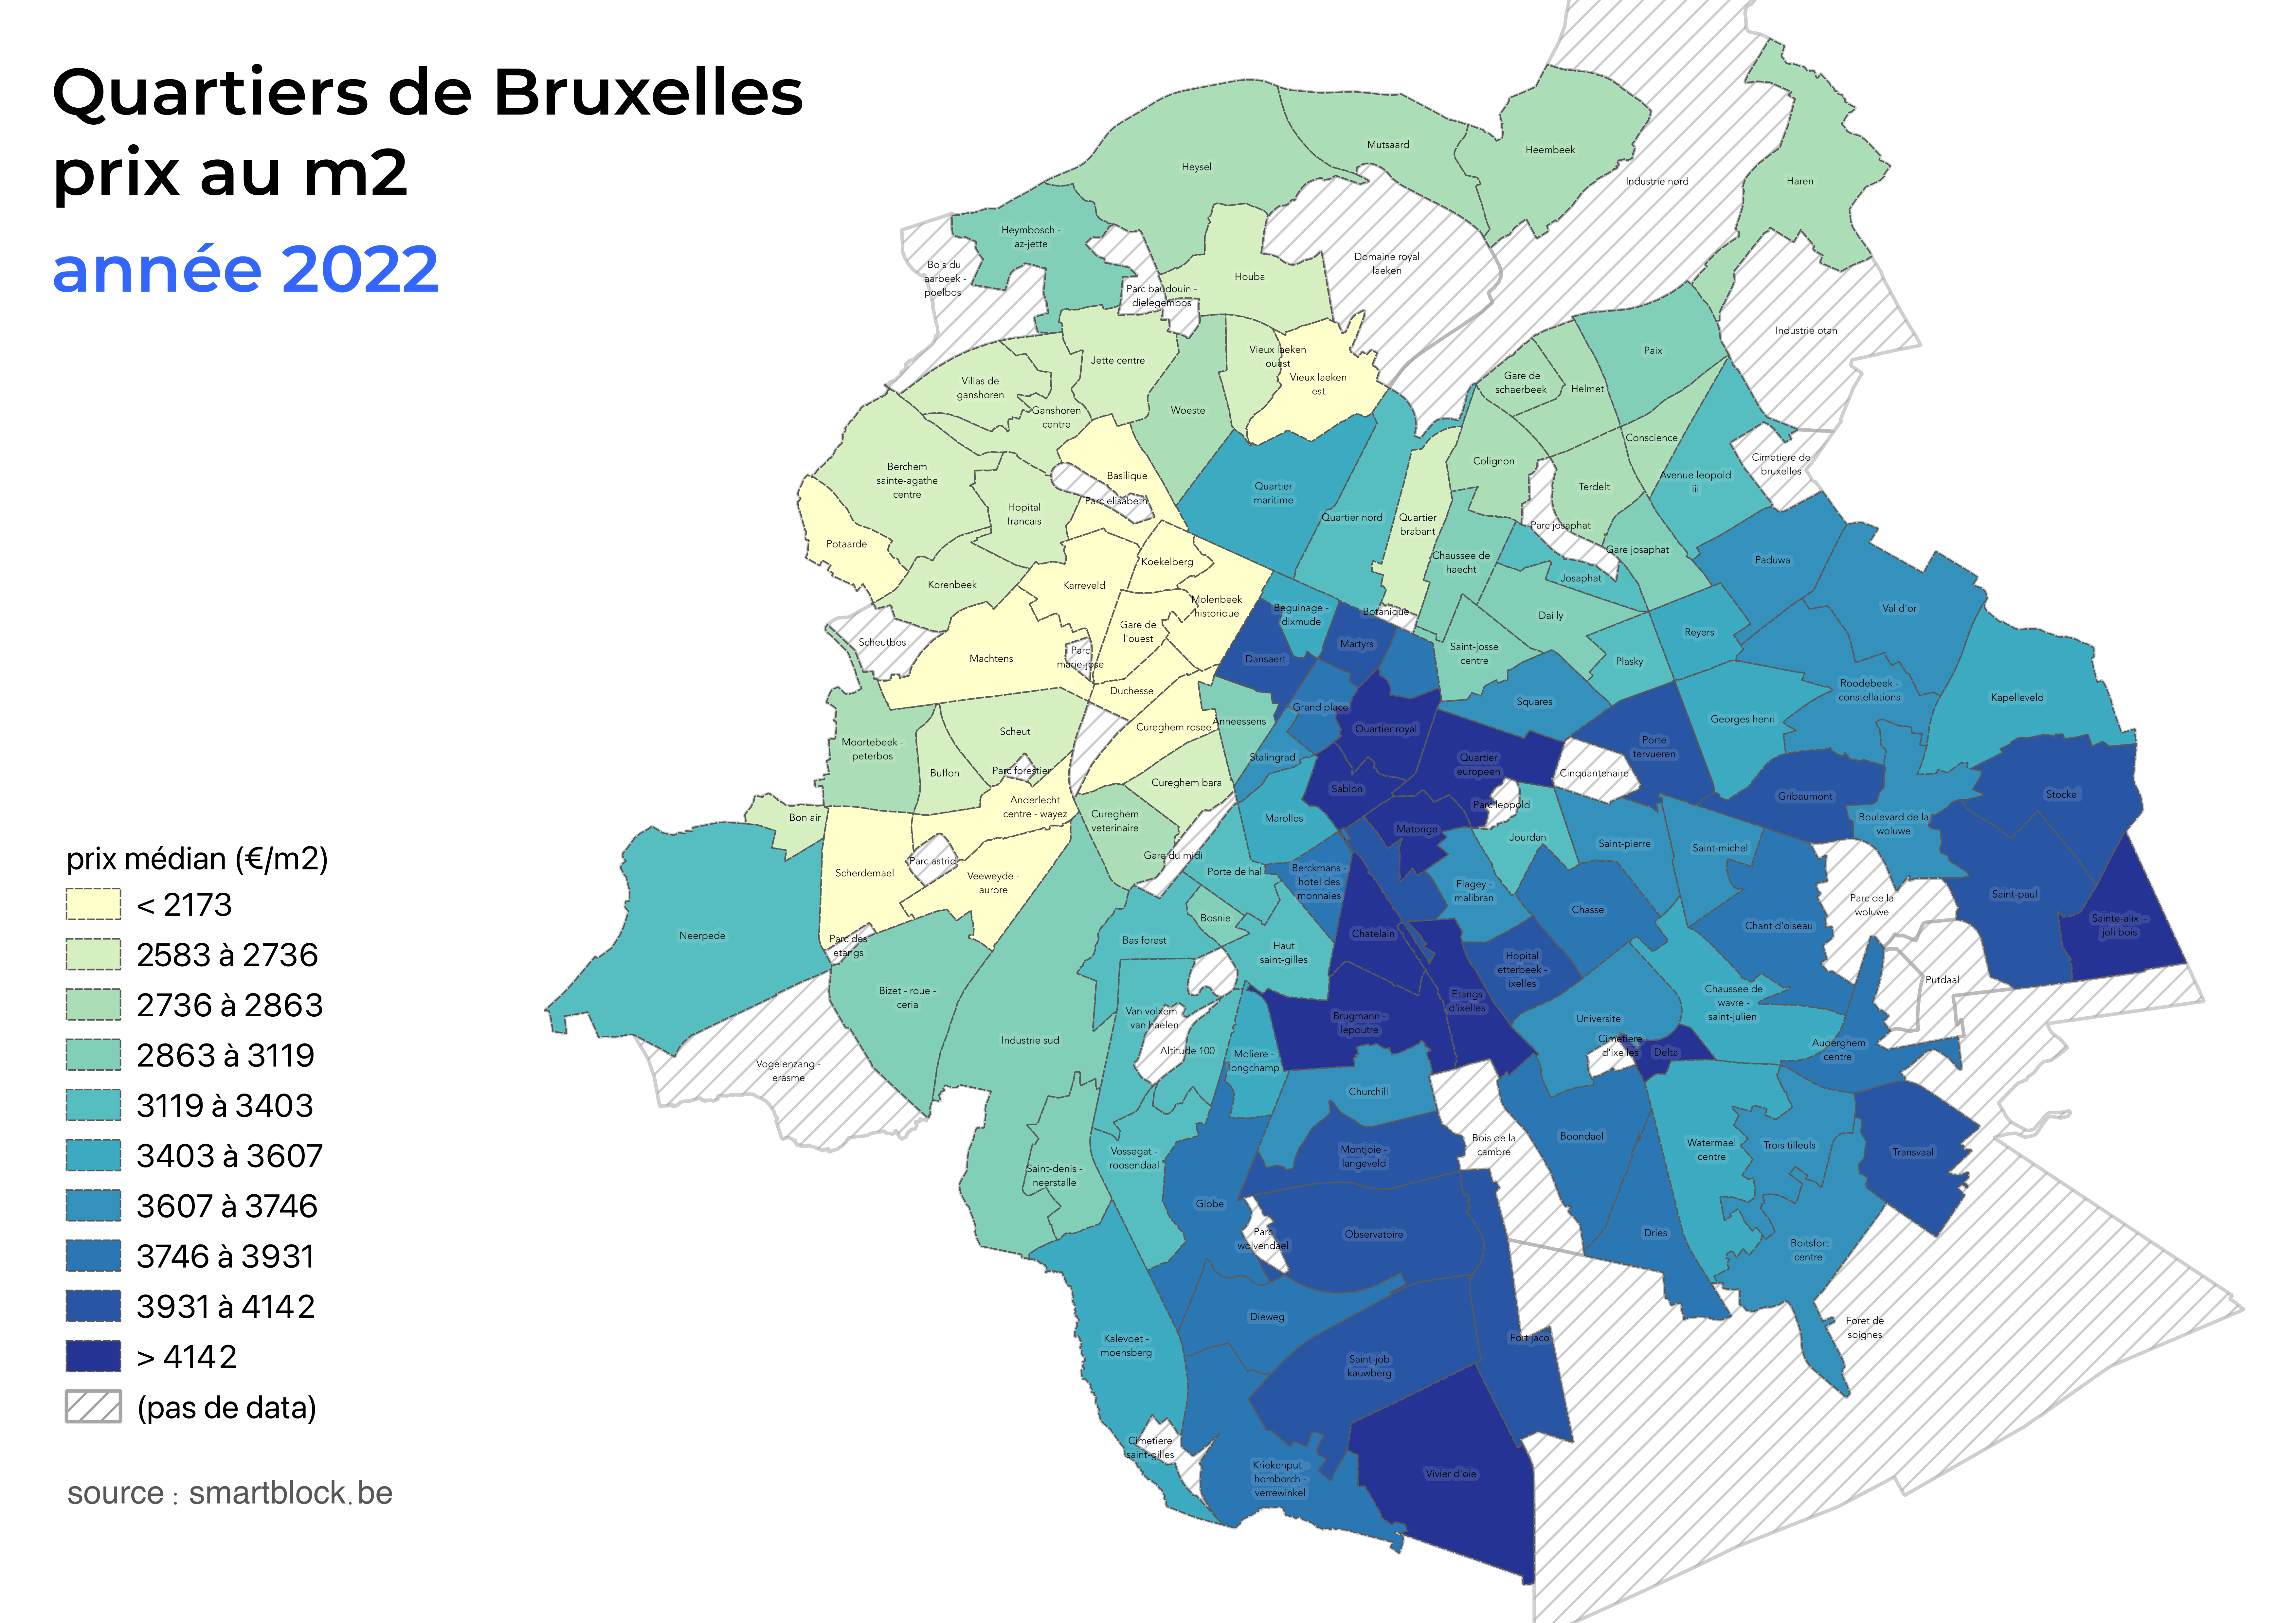
Carte des prix par quartier à Bruxelles (2022)
Historiquement, les communes les plus chères de Bruxelles sont situées au Sud et Sud-Est de la région. La carte suivante reprend le prix médian (au m2) pour le marché résidentiel (appartements et maisons) :