
When talking to a seller or a real estate agent, you’ll often hear that “the property just went live” or that “you need to hurry”. Before rushing in, take the time to check how long the property has actually been on the market. Here’s how to do it with Market Explorer.
➡️ Step 1: Search for the property
Go to Market Explorer, then search for the property in question by its address or its characteristics (type, price, location).
➡️ Step 2: Analyze the displayed price
Once on the property’s page, you’ll see:
- The current price displayed online
- Any price reductions already applied
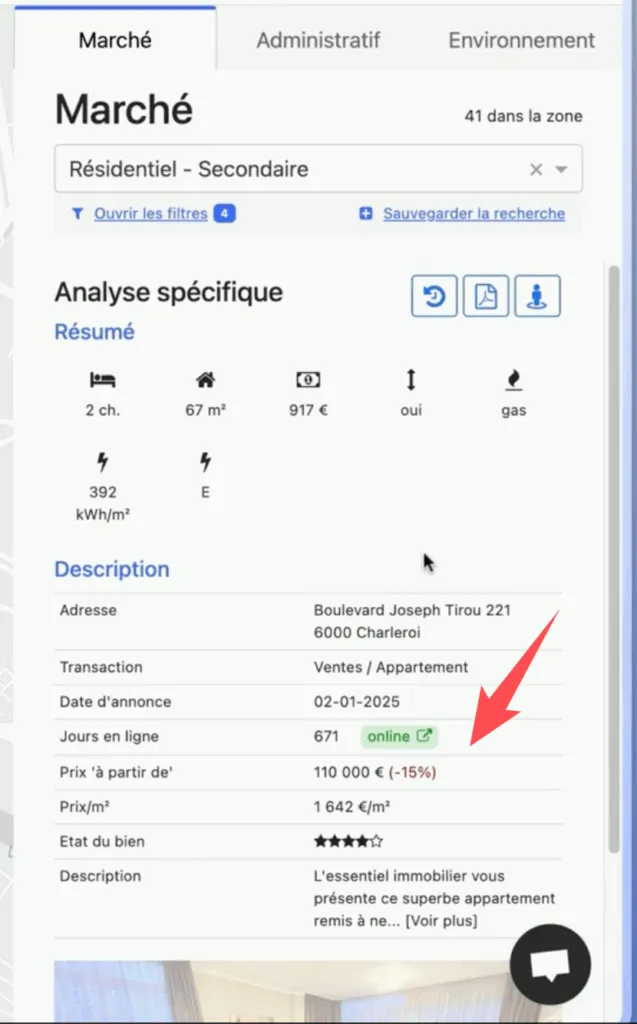 The display of the price and its evolution since the property was first listed, in Market Explorer
💡 In our example, the property is currently listed at**€110,000** , with a 15% reduction since it was first put on the market.
➡️ Step 3: Display the price history
Click the “Show price history” button. You’ll get access to a detailed history of past listings.
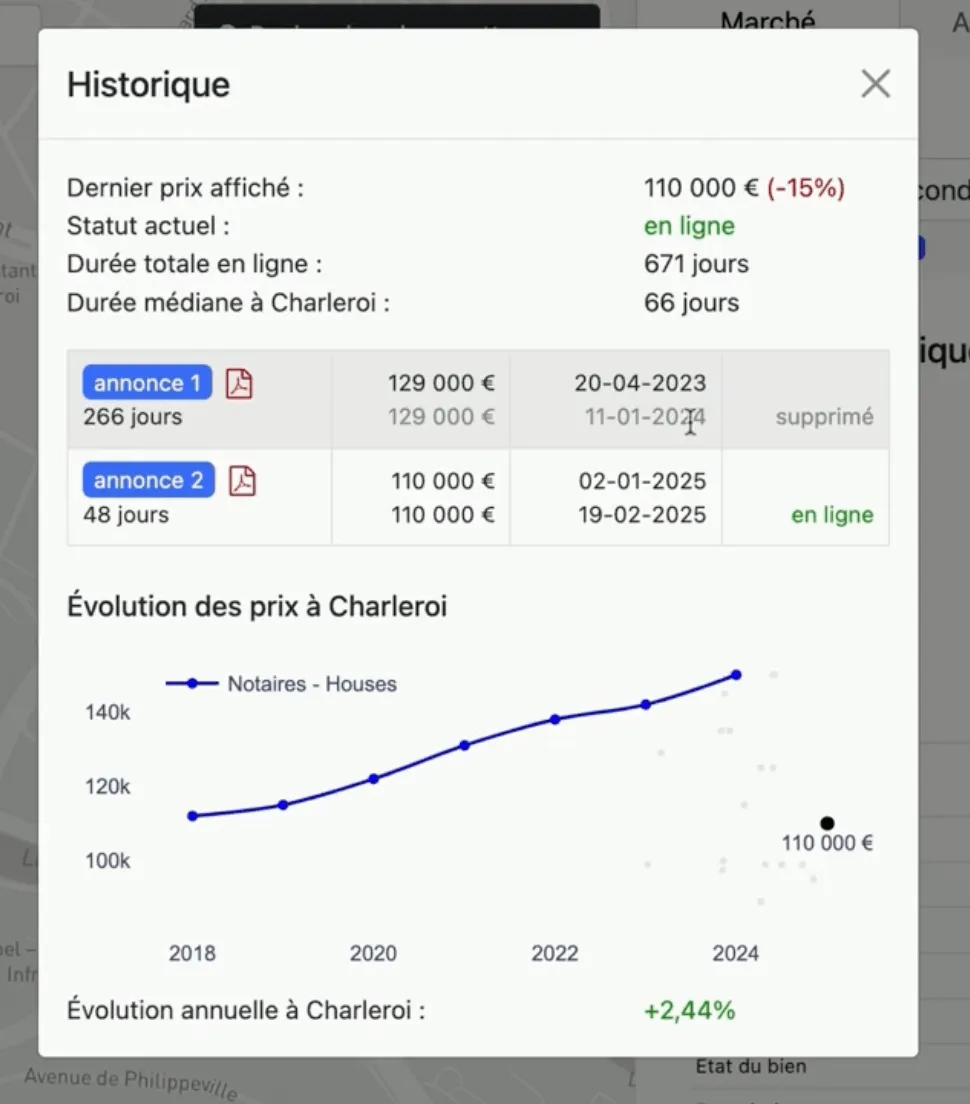 Market Explorer merges listings for the same property, letting you track prices over time.
You’ll see, for example:
- A first listing posted in April 2023 and taken down in January 2024
- Then a new listing posted in January 2025, at €110,000, but by a different agency
➡️ Step 4: Interpret the information
This timeline is essential:
- It reveals that the property isn’t really “new” on the market
- It shows the change of real estate agency
- It lets you assess the property’s liquidity and any previous attempts to sell it
🔎 Why does this matter?
- As an investor, you avoid falling into the trap of artificial scarcity.
- As a real estate agent, you can spot whether the owner already tried to sell on their own or with other agencies.
- You adjust your negotiation and your profitability analysis based on how long the property has actually been for sale.
✅ Conclusion
Don’t just take people’s word for it. Use concrete data and Market Explorer’s history to make informed decisions and gain negotiating power.
💬 Tip: make this a reflex for every viewing or property analysis you do.