

Valuation is an essential topic in real estate. There are many methods used for this by market players such as real estate agents, surveyors, developers, investors and notaries.
This article aims to explain how to value a property using the right method for your specific situation.
Table of contents
- Valuation by replacement value
- Valuation by income capitalization
- Valuation by comparison
- Comparison of methods
- Example
- Conclusions
Valuation by replacement value
Replacement value is certainly the simplest to understand and apply. It is the method used by insurance companies to determine the amount to be compensated. It simply involves considering that an identical property will be rebuilt on the land (already owned) and applying a depreciation factor based on the property’s condition (often a simple coefficient based on the year of construction).
Two replacement values must therefore be distinguished:
- New replacement value: this is simply the value of a similar property to be built
- Replacement value: this is the new replacement value to which a depreciation discount is applied
| New construction price | €300,000 |
|---|---|
| Depreciation coefficient (based on the age of the building) | 0.7 |
| Replacement value | 300,000 x 0.7 |
| = €210,000 |
Following the calculation above, a replacement value does not allow you to rebuild the property identically, since a reducing factor has been applied to the new replacement value.
Note that for the replacement value to be comparable to other methods, the land value must be added (which is automatically included in the other methods).
Why add the land value? When you rebuild a building, the cost of the land does not disappear, since the land itself remains unchanged. The reconstruction cost only accounts for what it costs to rebuild the building, but the land also has a value, often significant in certain areas (for example, in a city center or in sought-after locations).
So, if the replacement value of the building after depreciation is €210,000, the land value must be added to obtain a complete estimate. For example, if the land is worth €100,000, the total value of the property would be €210,000 (building) + €100,000 (land), i.e. €310,000.
Valuation by income capitalization
In the capitalization approach, the value is tied to the property’s rental income. The equation for the property’s value is as follows:
Present value = Net operating income / Capitalization rate
The capitalization rate is determined based on observation of the local market and the segment in question. Indeed, the capitalization rate depends on:
- Location: the capitalization rate is lower in prime locations. The underlying logic is that an investor accepts a slightly lower rent if the location is very good. Conversely, to attract an investor to a smaller town, the capitalization rate needs to be higher (proportional to the yield).
- The segment: the capitalization rate in commercial and retail real estate is higher than in residential, notably to cover the risk of rental vacancy.
To take an example, an investment property with an annual net operating income of €700,000 and a capitalization rate of 6% would be worth €11.7M.
The advantage of this method is that it takes into account the property’s actual yield. It tends to overvalue properties with a good yield (e.g. a student housing building) and undervalue properties with a poor yield (e.g. a single-family house).
Looking to determine a rental income or a capitalization rate in a real-world case? Check out our article how to value a property by capitalization to find out how to obtain this information directly in our analysis tool Market Explorer.
Valuation by comparison
Also called the “comparable sales method”, this is probably the most widely used and most intuitive method, since it simply involves comparing a property with similar nearby properties. These properties are then compared, taking their similarities and differences into account.
Indeed, two properties will never be perfectly identical. One might have been partially renovated while the other hasn’t, one might also have a veranda, a pool, or another feature increasing its market value.
You will first need to obtain comparables (via a listing site or a comparison-point tool) in order to list them in a spreadsheet with the key characteristics.
For a residential property, here is the main information to gather:
- The sale date or listing date
- The price
- The number of bedrooms
- The living area (as shown on the PEB energy certificate, for example)
- The condition of the property
- The energy performance
Here is a table of comparison points obtained using the Market Explorer application:
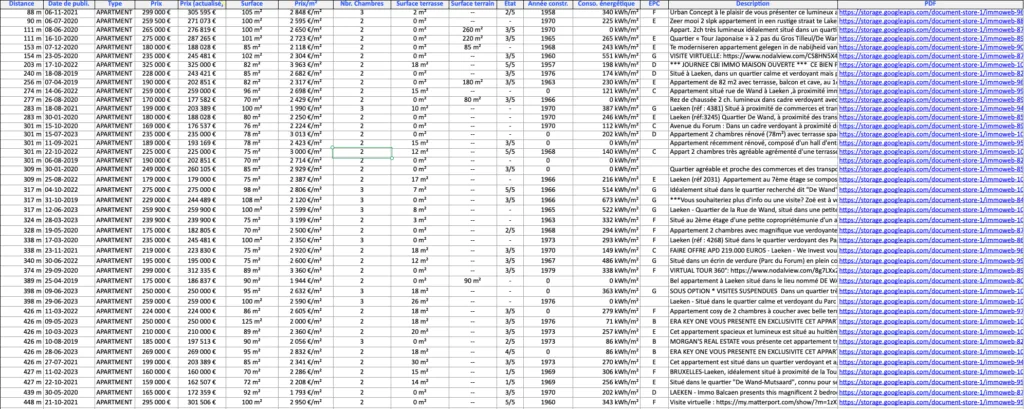 Comparables table obtained via Market Explorer
It is then very useful to calculate the price/m², the average price, or to produce a price histogram. This will let you complete your analysis with the minimum, median and maximum prices of the sample.
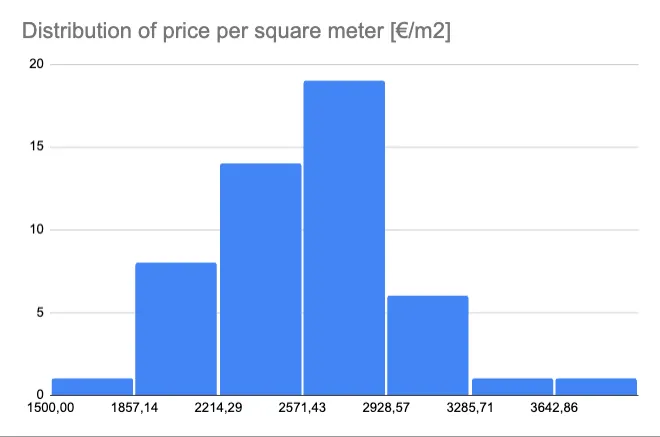 Price histogram
Thanks to the histogram, we can see that 19 properties fall within the range of €2,570/m² to €2,928/m². On the other hand, there is only one property below €1,857/m² and one property above €3,642/m². For this sample, the median price is €2,597/m².
Comparison of methods
Even though these methods are complementary, some of them should be favored in specific contexts. That’s what we’ll look at below:
| Method | Use case | Data required | Advantages | Disadvantages |
|---|---|---|---|---|
| Replacement value | Insurance | – Construction price (€/m2) | ||
| – Gross floor area (m2) | ||||
| – Level of depreciation | ✅ Easy to calculate | |||
| ✅ Requires little information | ❌ Simplistic approach | |||
| ❌ Sometimes quite far from market values | ||||
| ❌ Highly sensitive to the chosen depreciation coefficient | ||||
| Capitalization value | Investment property: income-producing building, student housing, office building or retail space. | – Actual or estimated rent | ||
| – Capitalization rate | ✅ Lets you take the investor’s position, with a yield target in mind | |||
| – Often allows for a higher value than other methods if the building is profitable | ❌ Can sometimes produce “off-market” values, if the building is very profitable (e.g. Airbnb rental) | |||
| Comparison value | Property not intended for yield | – Comparison points | ✅ Method that accounts for the actual state of the market | ❌ Requires obtaining comparison points, which can sometimes be hard to find |
| Comparison of the different valuation methods |
It is often very useful and instructive to compare the values obtained via the different methods, particularly in the case of a change of use (office to residential, traditional housing to student housing).
Example
Let’s take the case of a 200 m² house on a 1,000 m² plot on the outskirts of Nivelles (Walloon Brabant).
| Method | Calculation | Value obtained |
|---|---|---|
| Replacement valuation | – Land: €170,000 (€170/m2) | |
| – Construction: €360,000 (€1,800/m2) | ||
| – Depreciation: 25% | ||
| – Replacement value: €424,000 | €424,000 | |
| Capitalization valuation | – Rent: €1,280/month (€6.4/m2) | |
| – Capitalization rate: 3.4% | €384,000 | |
| Comparison valuation | – Median specific price: €2,088/m2 | |
| – Total price: €417,600 | €417,600 |
A few interesting points to note:
- for an investor, the expected yield will likely be at least 4% gross. To invest in the property, taking into account the rent and the expected yield, the investor would therefore not want to pay more than €384,000 (i.e. 8% less than the comparison value).
- the replacement value is quite sensitive to the chosen depreciation coefficient. Varying it by 5% up or down gives a range of €397,000 to €450,500.
- for an income-producing building, you can calculate the capitalization value (since it is an investment property) and divide the value by the surface area to obtain the price/m². You can then compare this price/m² to the one obtained by comparison.
Conclusions
We have looked at three valuation methods:
- Valuation by replacement value
- Valuation by income capitalization
- Valuation by comparison
Each of these methods can be used in a specific context, but it is always worthwhile to use them together and compare the results.
Do you need data for your estimates? Our Market Explorer application has extensive historical data across multiple market segments and throughout Belgium. Contact us to find out more!