
We analyzed the distribution of Cadastral Income, which determines Property Tax (précompte immobilier) in Belgium. This article explains why property tax can be considered opaque and unequal, from a statistical point of view!
Table of contents
- The calculation method
- Cadastral income
- What impact on Property Tax?
- What happens when the RC is reassessed?
- The real problem: the 1975 RC no longer reflects reality
- Cadastral Income inequalities in Brussels
- … and more broadly in Belgium
-
Conclusion
- Other statistical observations…
The calculation method
Cadastral income
Cadastral Income (RC, “Revenu Cadastral”) is the basis for levying Property Tax (PI, “Précompte Immobilier”) and for determining taxable property income under personal income tax.
The RC is a notional income corresponding to the average net annual income a property would generate for its owner. It is generally thought of as reflecting the “quality” of a dwelling.
This notional income was calculated by the General Administration for Patrimonial Documentation (AGDP, formerly the Cadastre) for the reference year 1975. It has not been updated since: to compensate, the RC is indexed annually. For 2024, the Federal Public Service (FPS) Finance set the indexation coefficient at 2.1763. In 2023, it was 2.0915.
What impact on Property Tax?
Property Tax (PI) is calculated as follows:
Property Tax = indexed RC x Overall rate Overall rate = regional rate + provincial rate + municipal rate (municipal surcharges, “centimes additionnels”).
The regional rate is set by the region, the provincial rate by the province, and the municipal rate by the municipalities. In Brussels-Capital and Wallonia, the regional rate is 1.25%. In Flanders, this rate is 3.97%.
Thus, the higher a property’s Cadastral Income (RC), the higher its property tax. Likewise, if an RC is mis-assessed (too low or too high), the Property Tax will be too.
What happens when the RC is reassessed?
Certain changes to a property trigger a reassessment of the RC. While such a reassessment is rarely requested directly by the taxpayer, it is typically initiated by the administration (the AGDP) once it becomes aware of the change through a third-party source (e.g. a building permit application).
Since it is not possible to reassess the 1975 rental value of the property directly, the AGDP mainly assesses the RC based on comparison points, for example within the same neighborhood. As such, Property Tax is an opaque tax.
The real problem: the 1975 RC no longer reflects reality
The problem with Cadastral Income lies in how it is updated: the indexation applied is uniform, meaning everyone’s RC increases in the same way, regardless of how each property’s characteristics have evolved or how attractive its location has become.
Likewise, the picture of potential rental income as calculated in 1975 no longer matches the Belgian market in 2024: some neighborhoods and municipalities have seen their quality of life increase drastically. Very few municipalities have had their Cadastral Income reassessed on a global scale since then. [1]
[1] “Réévaluation du revenu cadastral des habitations après transformation” (“Reassessment of the cadastral income of dwellings after renovation”), report of the Court of Audit submitted to the House of Representatives, 2013.
Cadastral Income inequalities in Brussels
We have seen that the Cadastral Income calculated in 1975 may no longer match current market conditions. Some municipalities have seen prices climb while others have stagnated: yet all see their RC indexed in the same way.
SmartBlock studied Cadastral Income across the Brussels-Capital Region:
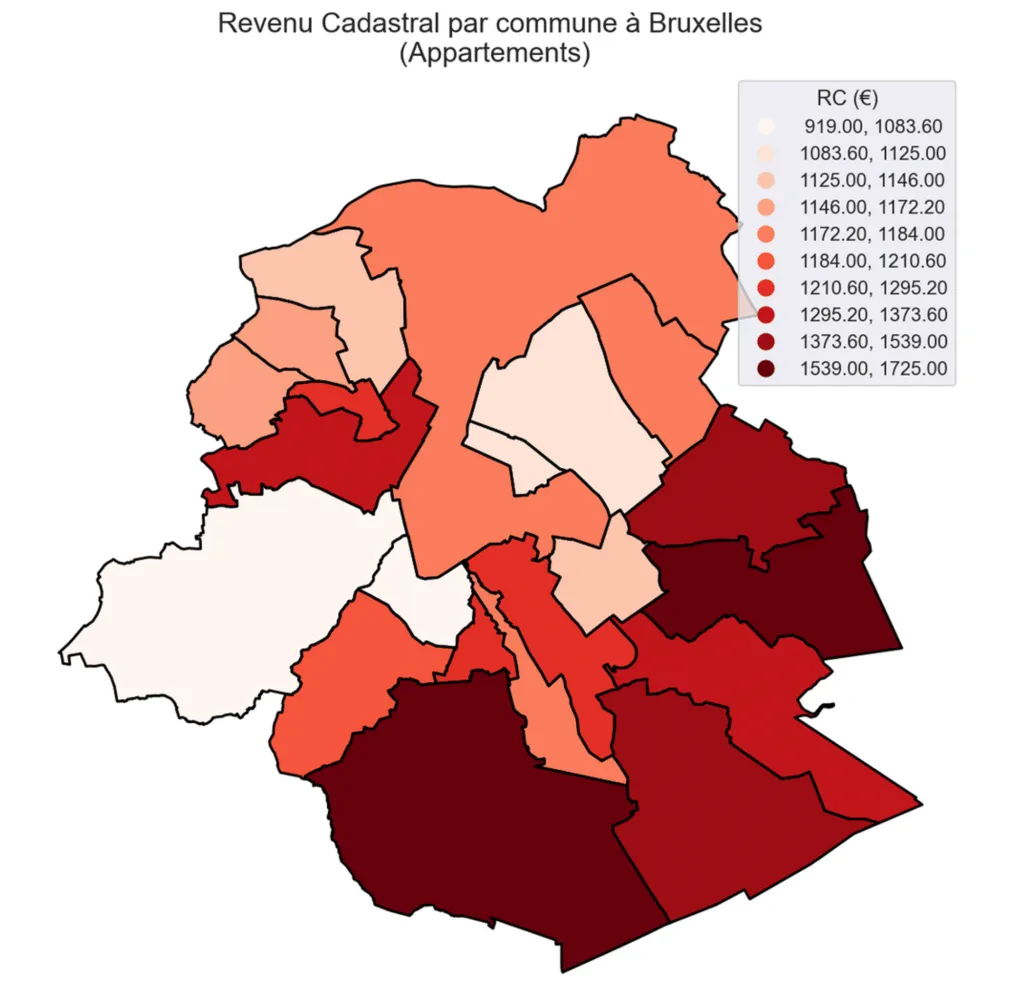 Non-indexed Cadastral Income by municipality. Apartments only.
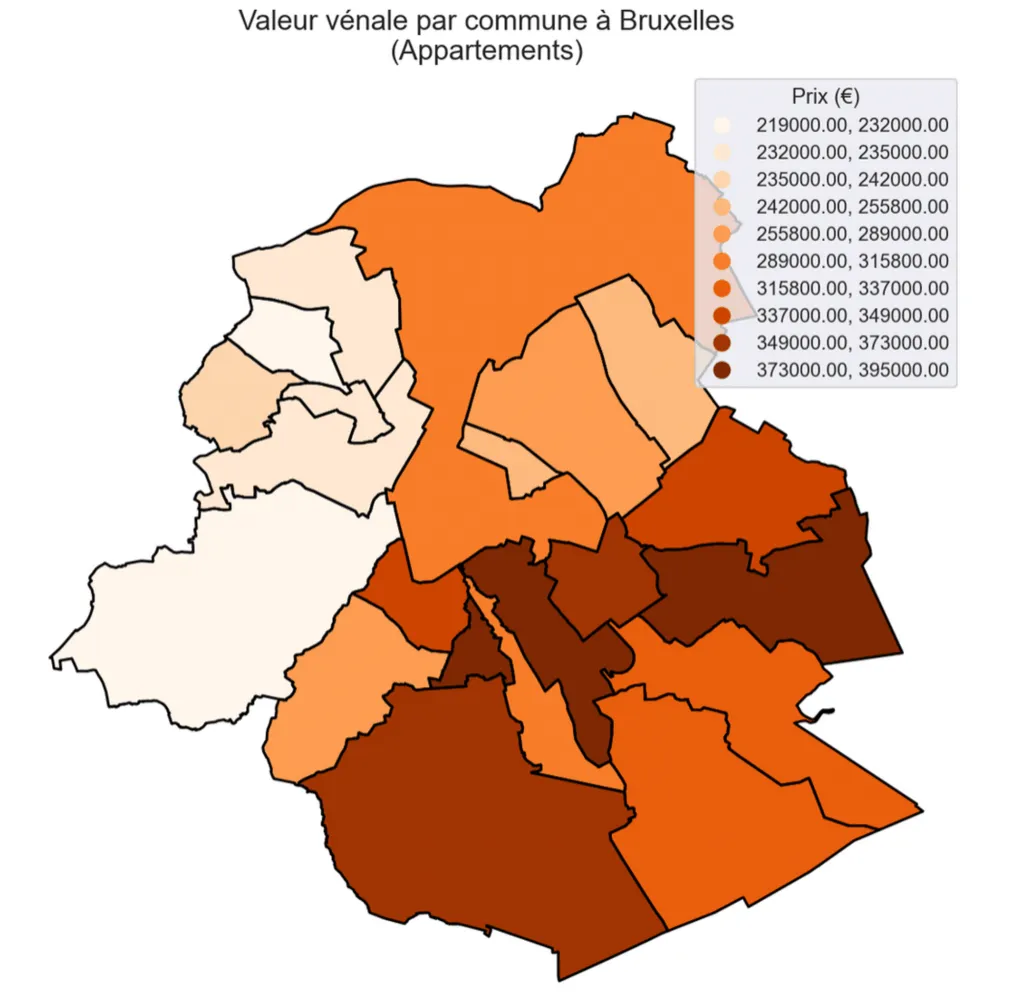 Real estate prices by municipality (2021-2023). Apartments only.
The map seems to indicate that the highest RCs are indeed located around the wealthiest municipalities, with a few exceptions: Etterbeek, Molenbeek and Koekelberg have RCs that are either too low or too high relative to current market values.
Let’s now look at the Cadastral Income, Property Tax and Price (€/m²) for each municipality:
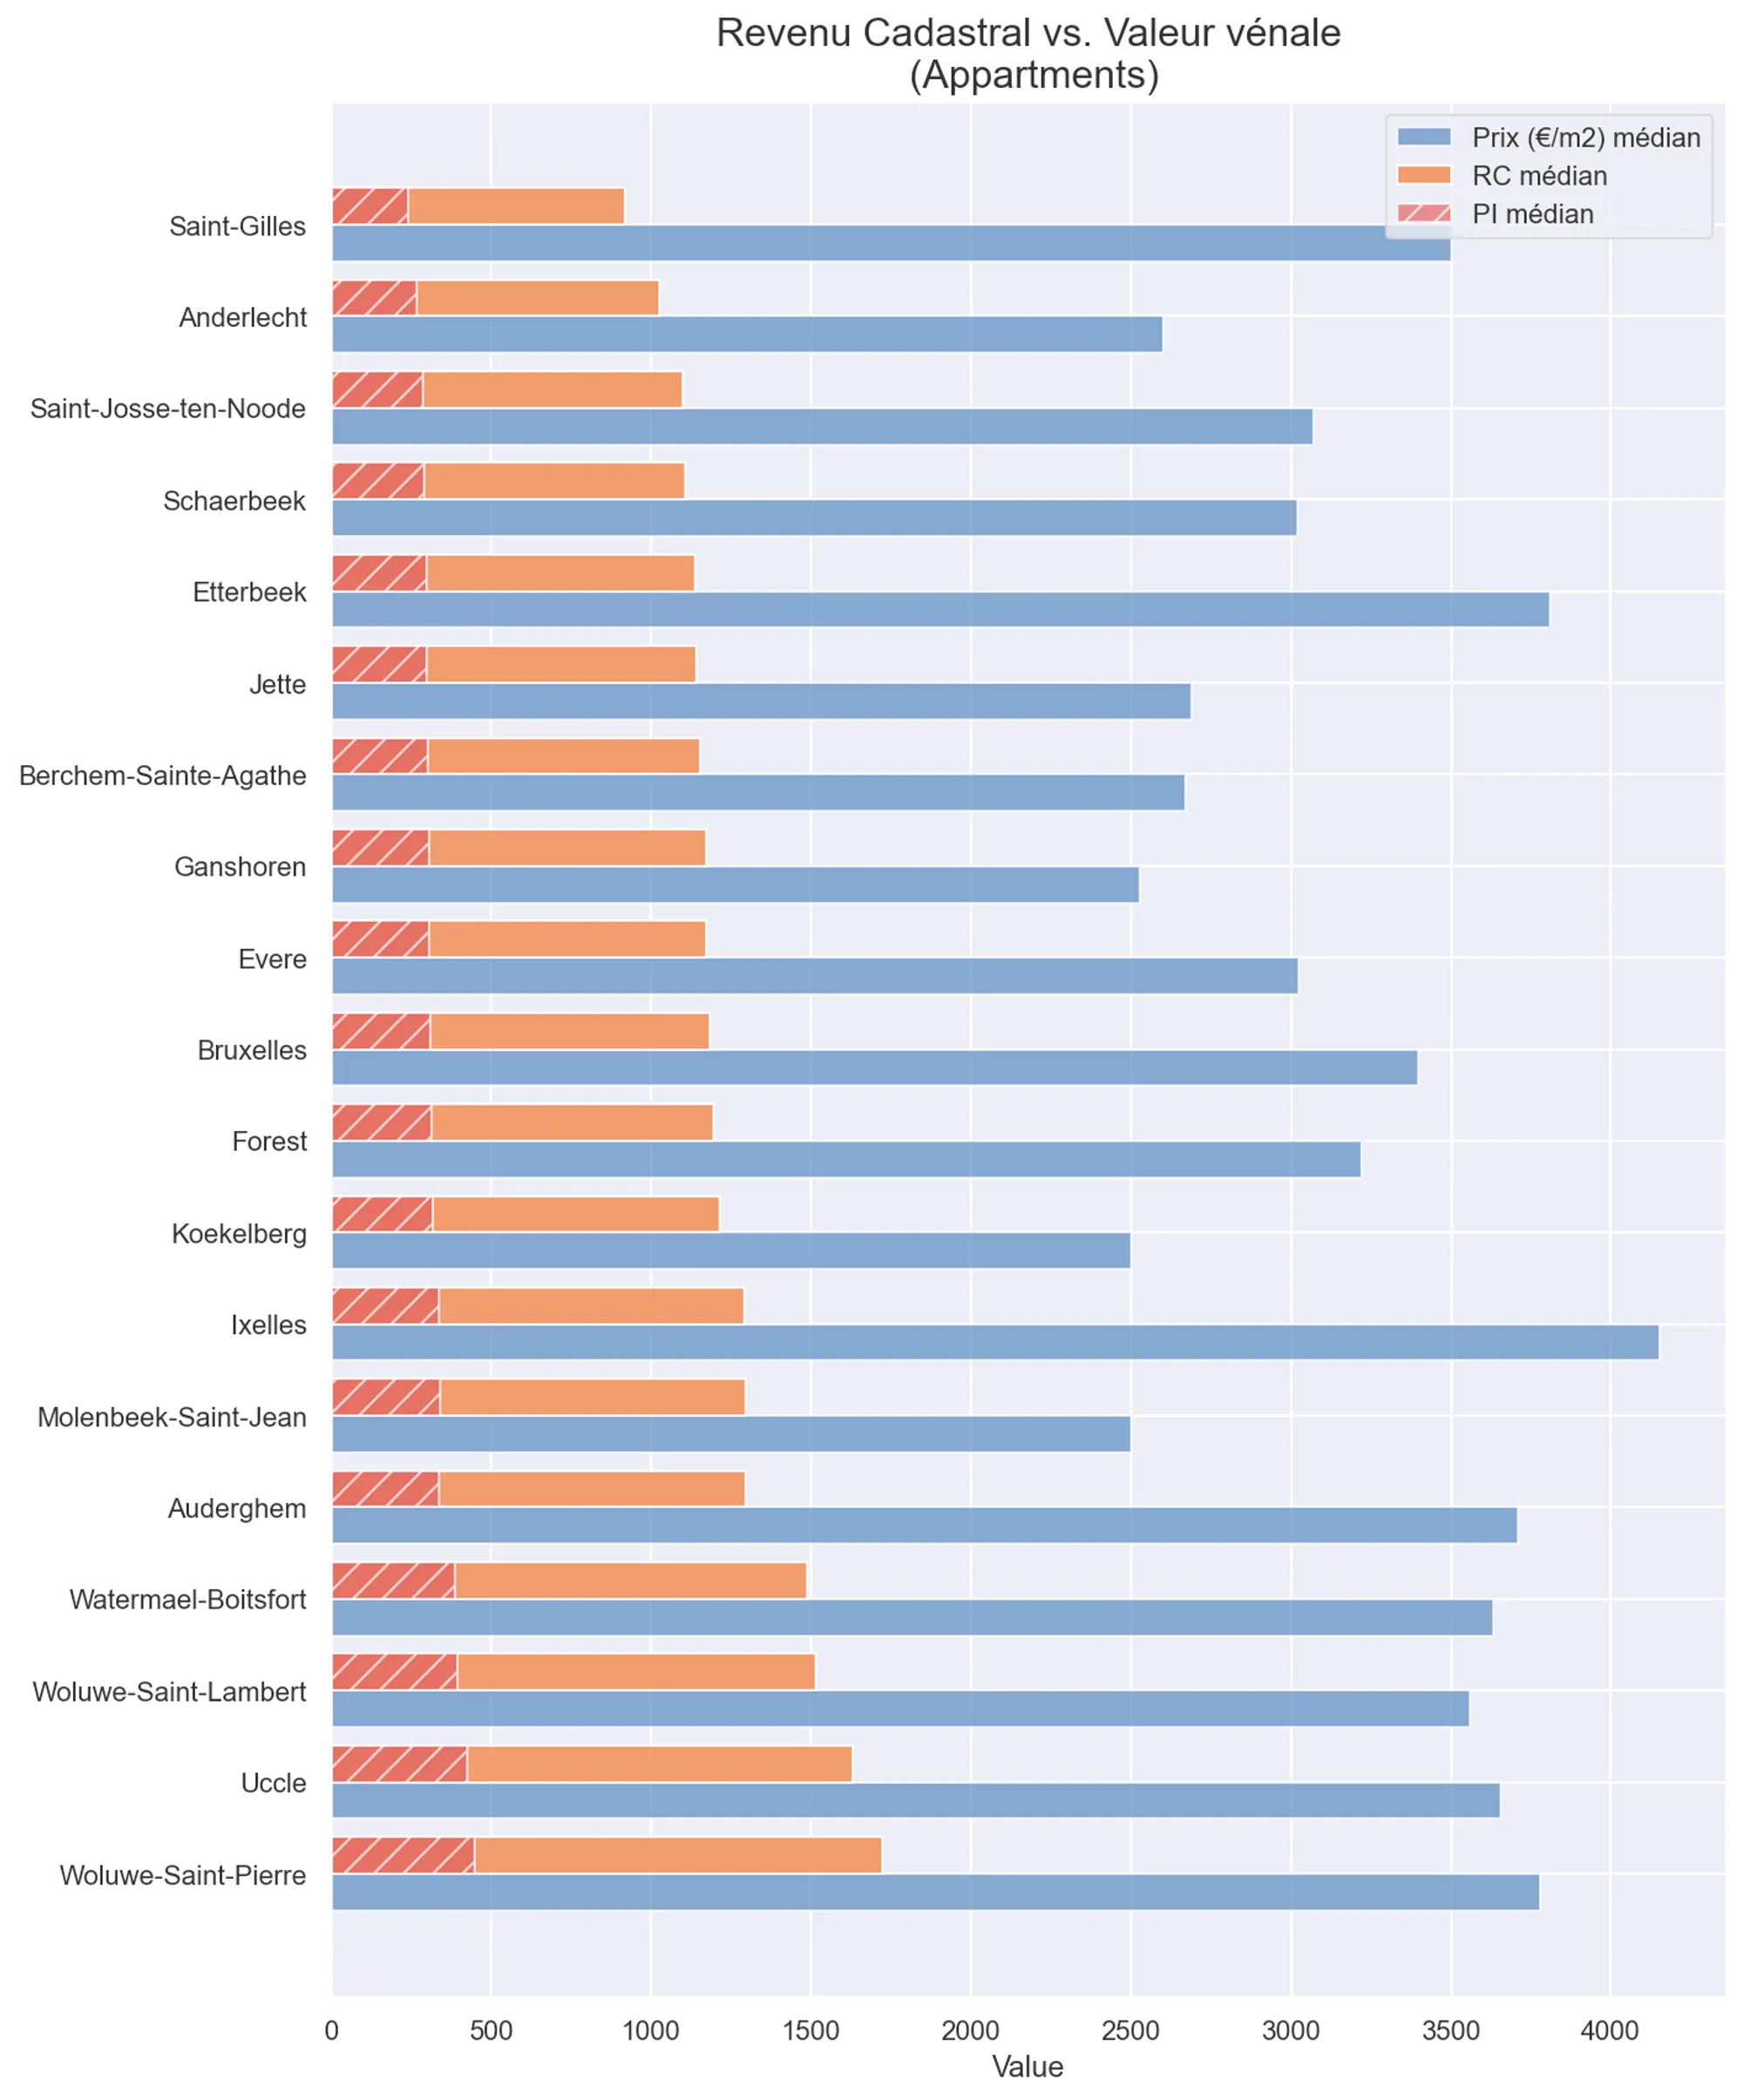 Cadastral Income, Property Tax and market value (per m²). Median Property Tax is calculated for 2023, while the Cadastral Income shown is non-indexed (1975). Prices correspond to 2021-2023.
The relationship between Cadastral Income and real estate prices (apartments) reveals notable disparities:
- Property Tax is generally lower in Saint-Gilles than in Anderlecht (for the same type of property)
- Property Tax is roughly equivalent between Ixelles and Molenbeek, or even Koekelberg, even though property values in Ixelles are 30% higher.
- Etterbeek also shows a very low RC relative to the value of properties on its market.
- Municipal surcharges (“centimes additionnels”), set by each municipality, do not offset this effect.
💡 Why this effect? Property Tax is based on Cadastral Income, calculated in 1975. Since 1975, some municipalities have seen prices soar alongside quality of life: Etterbeek and Saint-Gilles are good examples. See: the evolution of prices in Brussels-Capital.
Cadastral Income has not adapted to this evolution, and some municipalities where property values have not changed pay the same RC as those where the market has driven prices up dramatically.
… and more broadly in Belgium
But this effect is not limited to the Brussels-Capital Region, since RC indexation is identical everywhere. As a result, large disparities emerge between provinces or districts, and across the country as a whole.
SmartBlock studied the median RC of several Belgian cities, for typical property types: a 3-bedroom single-family house and a 2-bedroom apartment.
Typical house (3 bed.)
| Median Cadastral Income| Median sale price| ratio —|—|—|— Brussels-Capital| €1,279| €459,000| 0.28 Namur| €974| €275,000| 0.35 Antwerp| €793| €345,000| 0.23 Liège| €684| €199,000| 0.34 Mons| €683| €195,000| 0.35 Bruges| €675| €329,000| 0.21 Ghent| €552| €358,000| 0.15 Charleroi| €550| €169,000| 0.33
Ghent stands out significantly from other municipalities, with a very low average RC compared to high prices (top 3) for 3-bedroom houses. Antwerp and Bruges follow for the same reasons.
Typical apartment (2 bed.)
| Median Cadastral Income| Median sale price| ratio —|—|—|— Brussels-Capital| €1,243| €294,000| 0.42 Namur| €1,086| €219,000| 0.50 Liège| €981| €179,000| 0.55 Mons| €975| €160,000| 0.61 Charleroi| €941| €129,000| 0.73 Ghent| €902| €310,000| 0.29 Antwerp| €870| €229,000| 0.38 Bruges| €862| €269,000| 0.32
It is already striking that the median RC of a 2-bedroom apartment is similar to that of a 3-bedroom house (even though the floor area differs considerably: roughly ~90m² versus ~140m²).
As a result, the ratio between RC and property value is very high. Charleroi and Mons show the highest ratio relative to the median sale price for this type of apartment. Once again, the three Flemish cities show a very low RC compared to property prices.
💡 What does this mean? For an identical property, Cadastral Income is not necessarily correlated with real estate prices (nor with the rental market, which is also correlated with market value). Uniform indexation does not correct this phenomenon.
Once again, the ratio between RC and market value highlights the disparities:
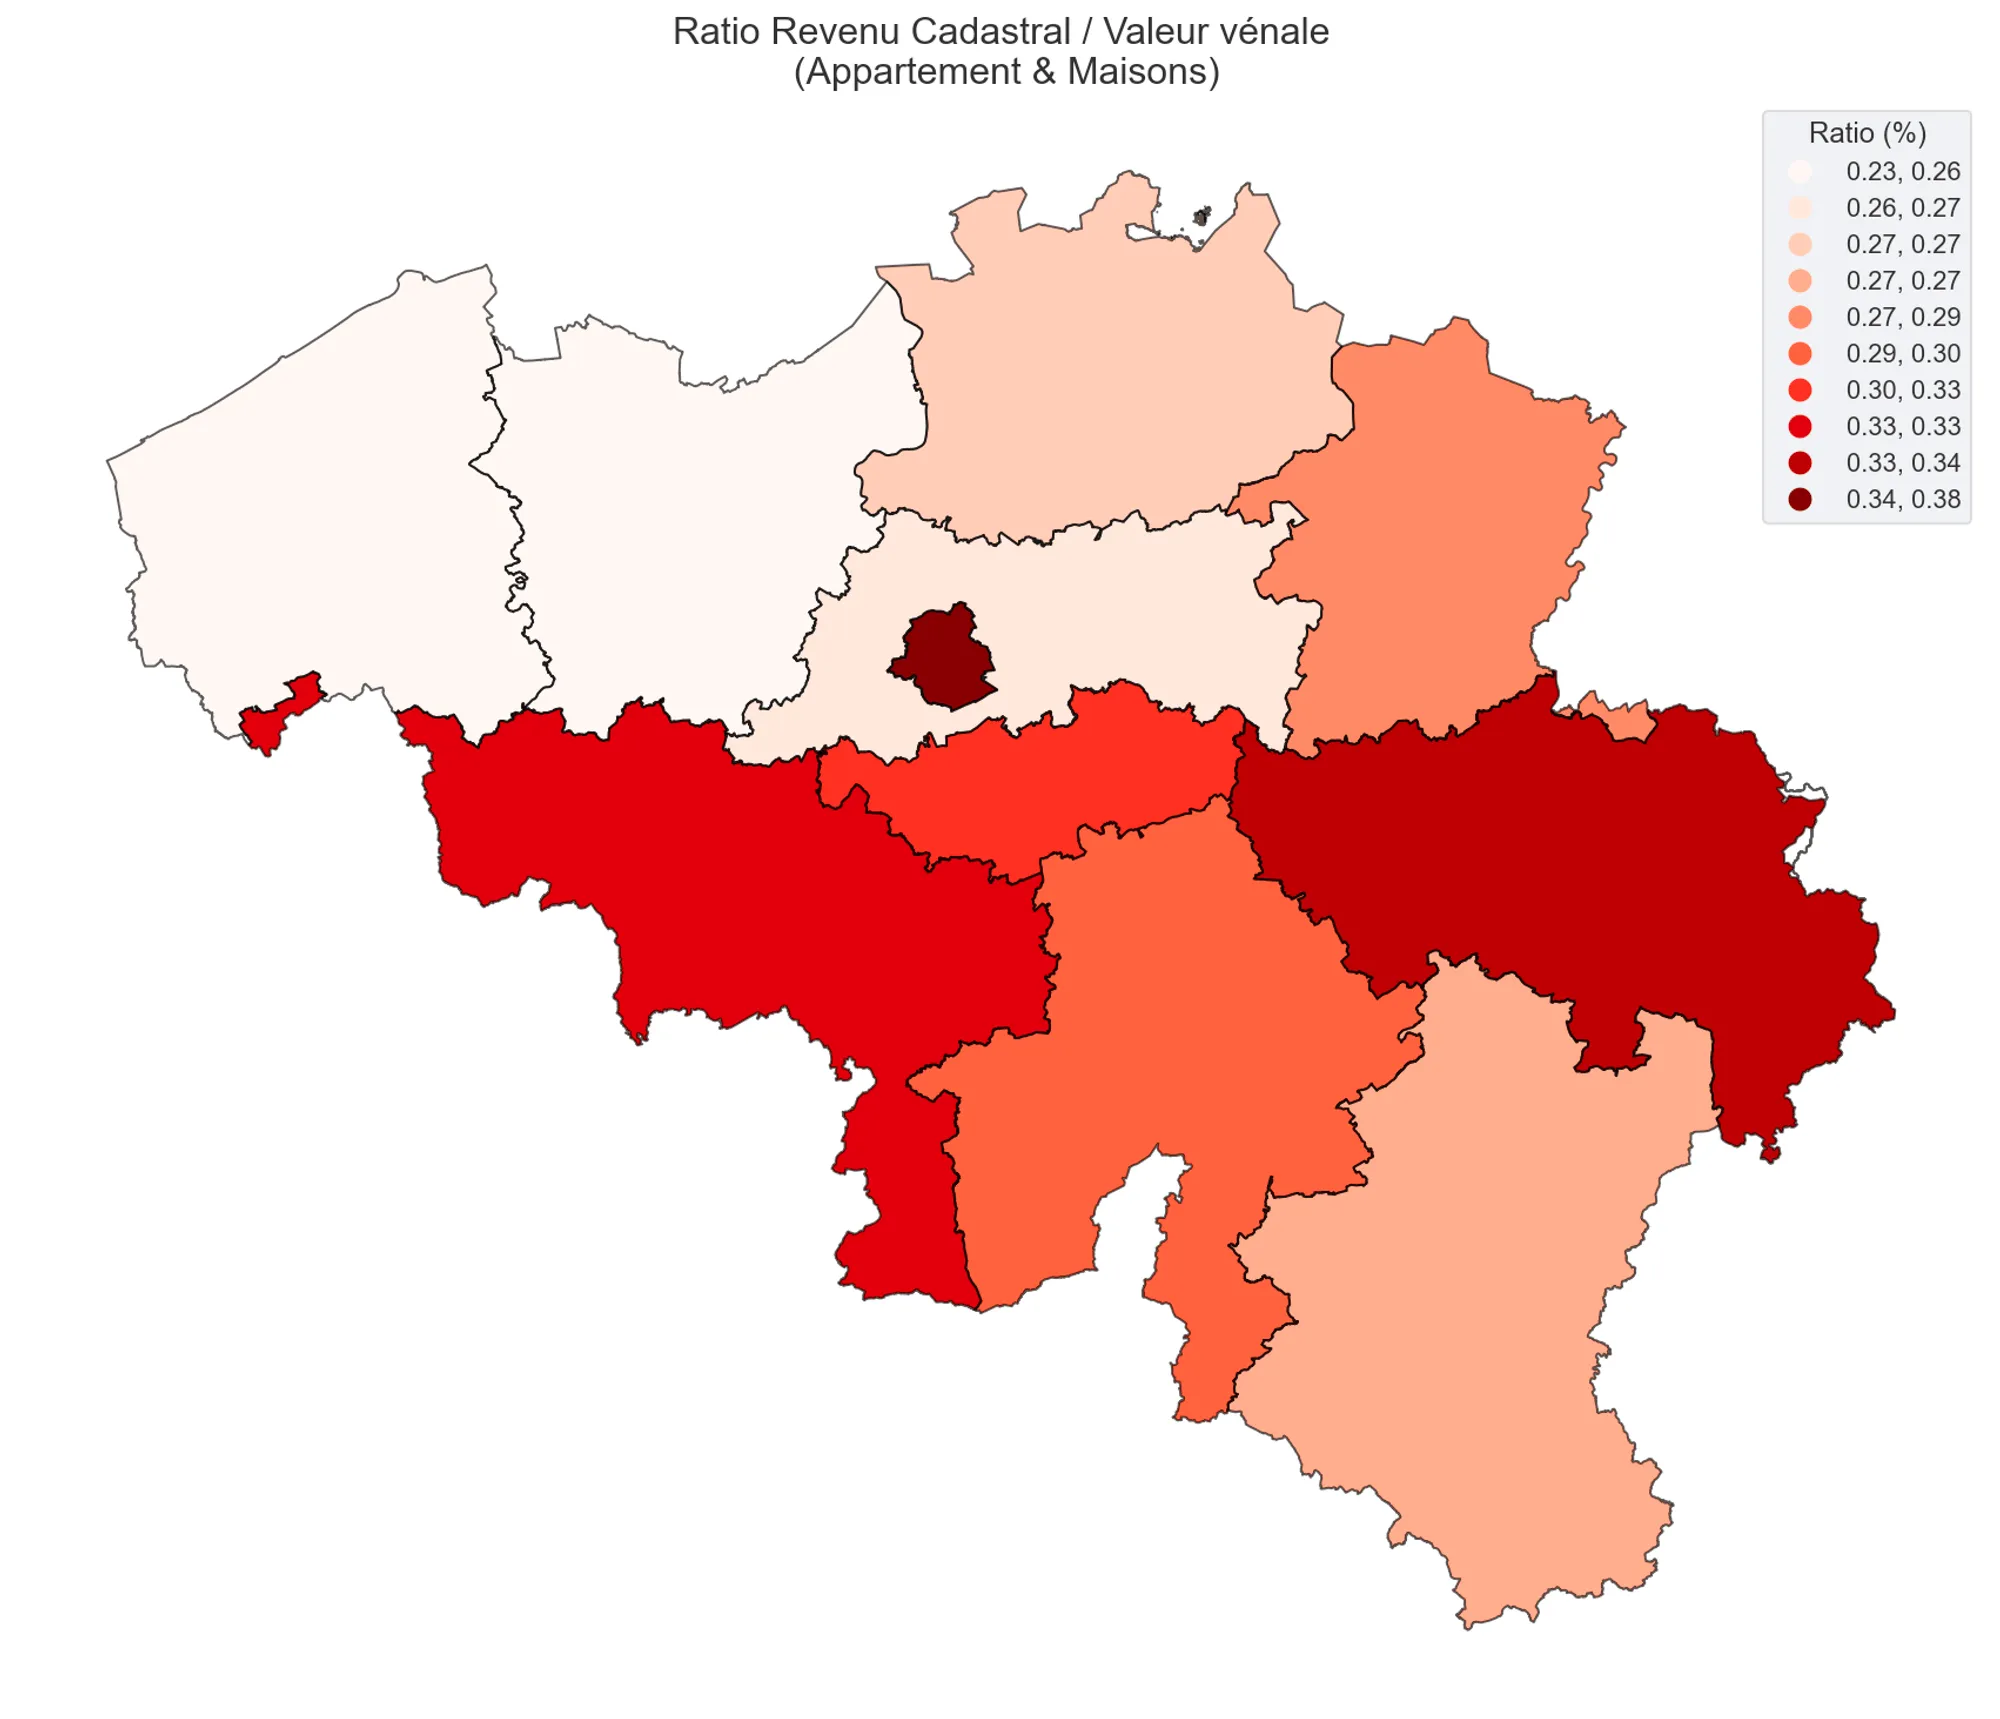
Ratio between median Cadastral Income and median market value, for 2023. The redder the color, the higher the Cadastral Income for every €100,000.
- The province of Liège has the highest median Cadastral Income relative to real estate market values (houses and apartments).
- Brussels-Capital and Flanders have the highest Cadastral Incomes. However, Flemish properties have a particularly low RC relative to their market value.
- The difference between Flanders and Wallonia is marked, and overall this ratio is most favorable in West Flanders and East Flanders.
Conclusion
- Property Tax is based on Cadastral Income, a notional income established for 1975 that has not been reviewed since.
- The evolution of the real estate market has increased property values in certain municipalities without a corresponding adjustment of Cadastral Income.
- There are disparities between neighborhoods and municipalities: for a similar property, the RC is identical in municipalities with very different real estate markets (purchase prices, rental markets).
- As a result, owners of properties with high market values pay a Property Tax similar to that of properties in less affluent areas.
- Cadastral Income revisions are made sparingly, only when a property undergoes major changes. It is then possible to file a complaint if the new RC seems inadequate, but it is best to be accompanied by an expert and concrete data justifying the RC submitted to the administration.
💡 Are you paying too much Property Tax? SmartBlock has set up a simulator that lets you calculate your RC and compare it to your neighborhood and municipality.
Other statistical observations…
- We saw the press react strongly to the increase in municipal surcharges (“centimes additionnels”) in certain municipalities in 2023 (e.g. Forest, Schaerbeek). It should be put into perspective that municipal surcharges represent a relatively small share of the rate applied to the RC. It is really the difference in Cadastral Income between municipalities that drives the differences in Property Tax between them. Example:
- Schaerbeek: 4,191 surcharge points → median Property Tax of €290
- Woluwe-Saint-Pierre: 1,725 surcharge points → median Property Tax of €451
- On the other hand, the increase in the Cadastral Income indexation coefficient from 1.9084 (2022) to 2.0915 (2023) has a real, direct impact on Property Tax, since this value is the base multiplied by the regional/provincial/municipal rate.
- Calculating Cadastral Income is far from straightforward: SmartBlock attempted to calculate the rental income of 200,000 properties and compare it with their indexed Cadastral Income.
- While rental income is correlated with the RC indexed in 2023, the Cadastral Income is lower by a factor of 3 or 4.
- It is difficult to say that the RC corresponds exactly to rental income, just as it is difficult to find a strong link with comfort-related characteristics that are often highlighted (presence of central heating, number of bathrooms, etc.).